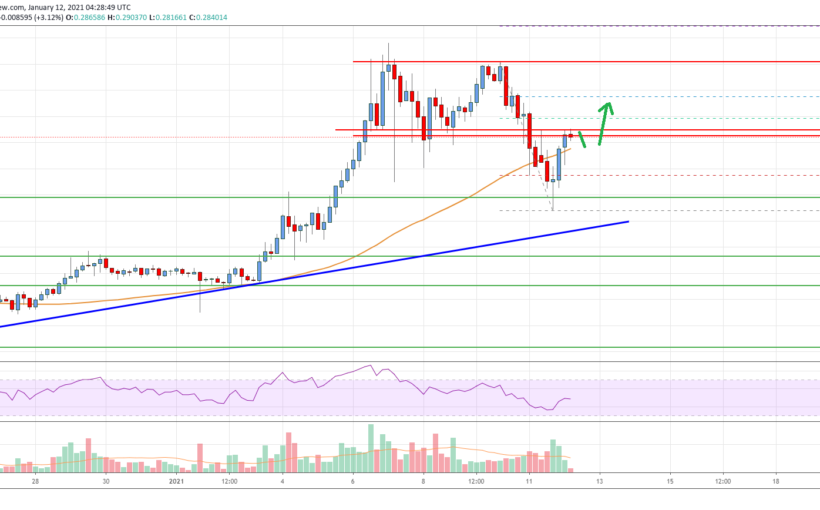
Cardano price is recovering losses from the $0.2200 support zone against the US Dollar, similar to bitcoin. ADA price must clear the $0.3000 barrier to continue higher in the near term.
Cardano Price Analysis
Cardano price started a strong surge after it settled above the $0.2000 resistance against the US Dollar. The ADA/USD pair broke the $0.3000 resistance level and settled above the 55 simple moving average (4-hours).
There was also a break above the $0.3400 level and the price tested the $0.3500 zone. It seems like the bulls struggled to retain strength above $0.3400, resulting in a sharp decline. There was a nasty decline of over 20% and the price broke the $0.3000 support.
There was also a break below the $0.2500 level and the 55 simple moving average (4-hours). However, the price remained well bid above the $0.2200 zone. There is also a major bullish trend line forming with support near $0.2200 on the 4-hours chart.
A swing low is formed near $0.2279 before the price started recovering losses. It broke the $0.2500 resistance level. There was a clear break above the 23.6% Fib retracement level of the recent decline from the $0.3422 high to $0.2279 low.
The price is now facing hurdles near $0.3000, but trading above the 55 simple moving average (4-hours). The 50% Fib retracement level of the recent decline from the $0.3422 high to $0.2279 low is acting as a strong resistance near the $0.2850 zone.
A clear break above the $0.3000 resistance zone could open the doors for a fresh rally. In the stated case, the price is likely to continue higher towards the $0.3400 zone.
Conversely, the price could correct again from $0.3000. An initial support is near the $0.2750 level and the 55 simple moving average (4-hours). The main support is now forming near the $0.2200 zone.
Cardano (ADA) Price
The chart indicates that ADA price is clearly attempting an upside break above $0.3000 and it is above the 55 simple moving average (4-hours). Overall, the price is likely to continue higher once it clears the $0.3000 resistance zone.
Technical Indicators
4 hours MACD – The MACD for ADA/USD is gaining pace in the bullish zone.
4 hours RSI – The RSI for ADA/USD is currently close to the 55 level.
Key Support Levels – $0.2750 and $0.2500.
Key Resistance Levels – $0.3000 and $0.3400.
Source: Read Full Article
