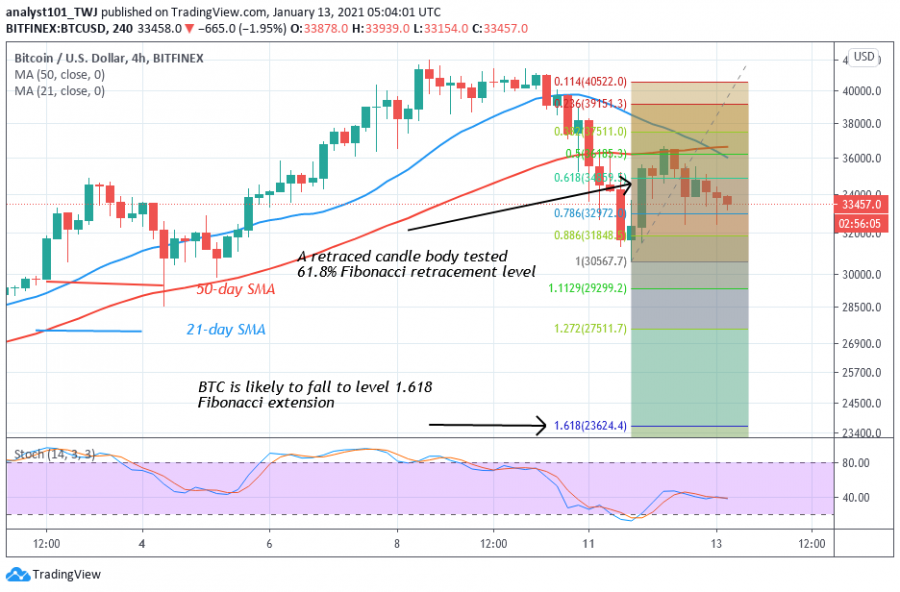
Bitcoin has continued to fall after a second rejection from the recent high. The coin is still fluctuating above the $33,000 support.
There is a tendency for the price to retest the previous support at $31,000. A break below the current support will mean a further downward movement of the coin. If the price rebounds above the support, there is the likelihood of upside momentum.
Bitcoin’s decline is not unconnected with the recent rallies. Bitcoin has been trading in the overbought region after breaking the psychological price level of $20,000. The bullish momentum continued as Bitcoin traded above $40,000 high. Nevertheless, there is always a risk of a sharp decline in vertical rallies. Bitcoin is trading at $33,284 at the time of writing.
Bitcoin indicator reading
BTC price retests 21-day SMA. A break below the SMAs suggests a decline of the BTC price. BTC price is at level 57 of the Relative Strength Index period 14. Bitcoin is in the uptrend zone and above centerline 50. The 21-day and 50-day SMAs are sloping upward indicating the current uptrend.
Key Resistance Zones: $40,000, $41,000, $42,000
Key Support Zones: $20, 000, $19, 000, $18,000
What is the next direction for BTC/USD?
Bitcoin is struggling above the $33,000 support as bears continue to push on the downside. A Fibonacci tool has indicated a downward movement of the coin. On January 11 downtrend; a retraced candle body tested the 61.8% Fibonacci retracement level. The retracement gives the impression that BTC will fall to level 1.618 Fibonacci extensions. That is a low of $23,624.40.
Disclaimer. This analysis and forecast are the personal opinions of the author that are not a recommendation to buy or sell cryptocurrency and should not be viewed as an endorsement by CoinIdol. Readers should do their own research before investing funds.
Source: Read Full Article


