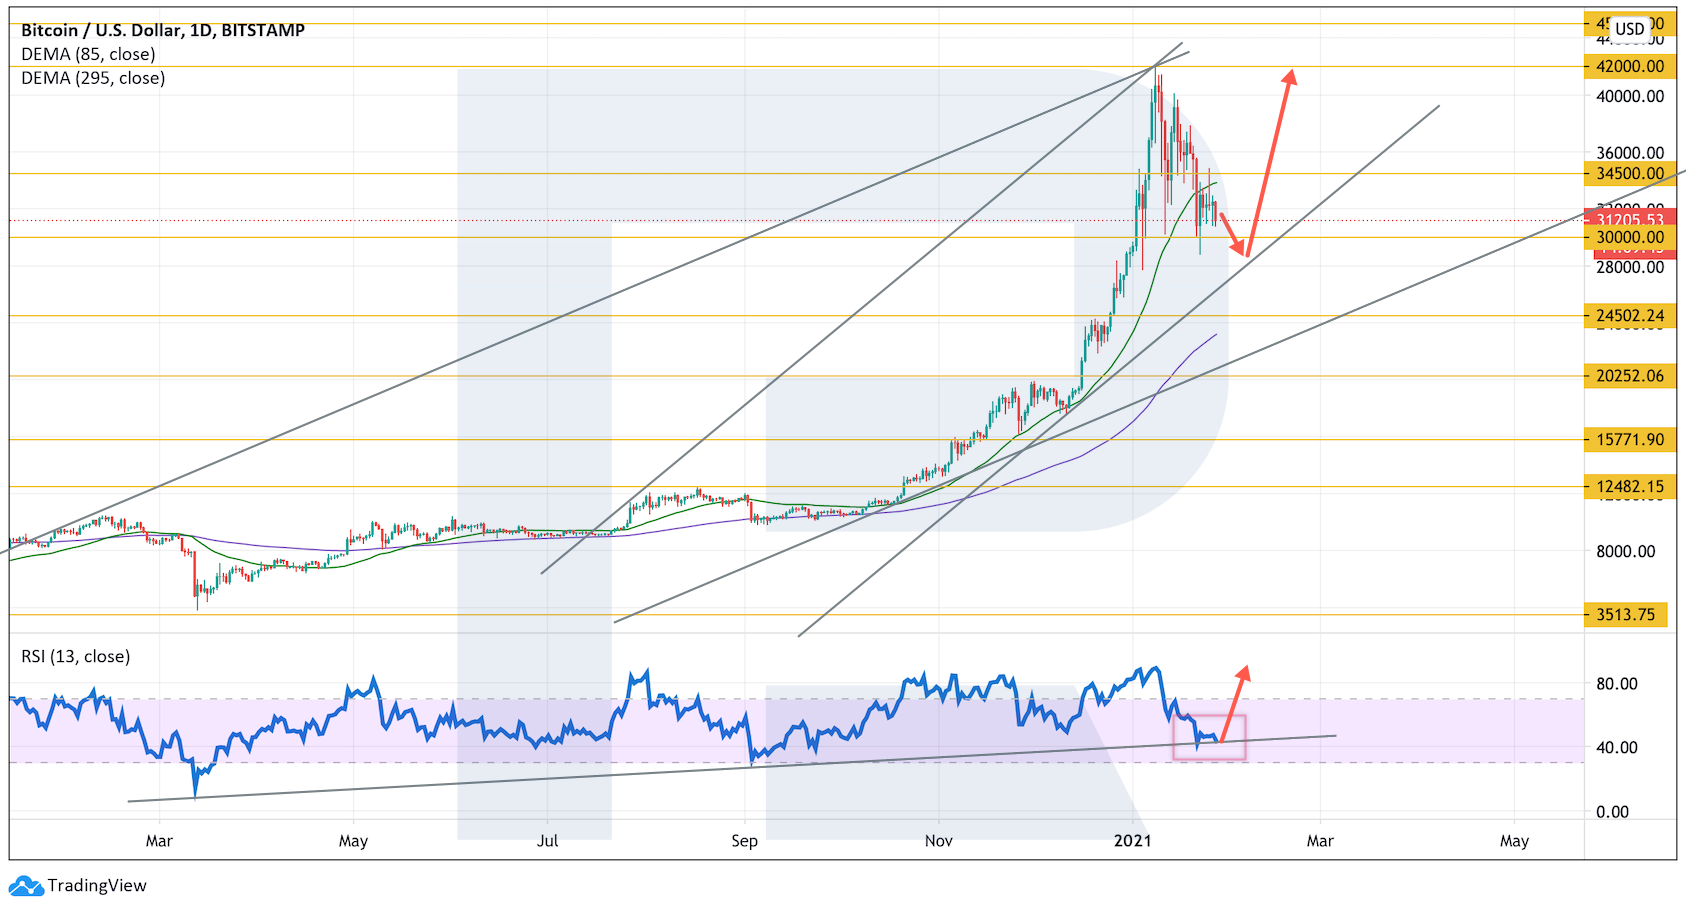
After failing to rebound from the downside border of a Triangle pattern and breaking it, BTC/USD has tested it once again; right now, it is trading close to $31,000. If we measure the distance equal to the pattern’s height from the breakpoint, then the downside target may be at $22,000. That’s why if the price fixes below $30,000, it may continue falling within the frameworks of the pattern materialization.
In the daily chart, the RSI is once again “sticking” to the support line, which may be a strong signal in favor of a rebound from the current level to the upside and a further ascending tendency. Another signal to confirm this idea will be a rebound from the rising channel’s downside border.
Despite such a significant decline of the asset, when the price was testing $30,000, Michael Saylor twitted again that MicroStrategy had bought 314 more Bitcoins at the average price of $31,808 for the total sum of $10 million. The last time he announced a big purchase on December 21st, 2020 when the price went upwards after a slight correction. However, at that time the purchase was worth $650 million. By doing so, Saylor hints that the cryptocurrency should be bought not at its highs but when it plummets.
Another factor that says that the descending correction might be over is the growing number of addresses with more than 1,000 Bitcoins. A new all-time high was recorded here, 2.446 addresses. The number added 140 addresses in the last 20 days alone and it may indicate that “whales” are ready for another BTC surge in the nearest future. In general, this confirms the theory that Bitcoins are steadily moving from smaller players of the cryptocurrency market to higher-income “tycoons”.
At the same time, the American government’s interest in digital currencies is deepening as well. Janet Yellen, who has recently become the United States Secretary of the Treasury in Joe Biden’s office, said that she was worried about the illegal use of cryptocurrencies. She emphasized that such assets provided the opportunity to bypass the current financial system and undermine U.S. interests. However, Saylor is sure that the new regulations for digital currencies will eventually turn out to be positive for Bitcoin growth. This approach may boost the attraction of institutional money to the market.
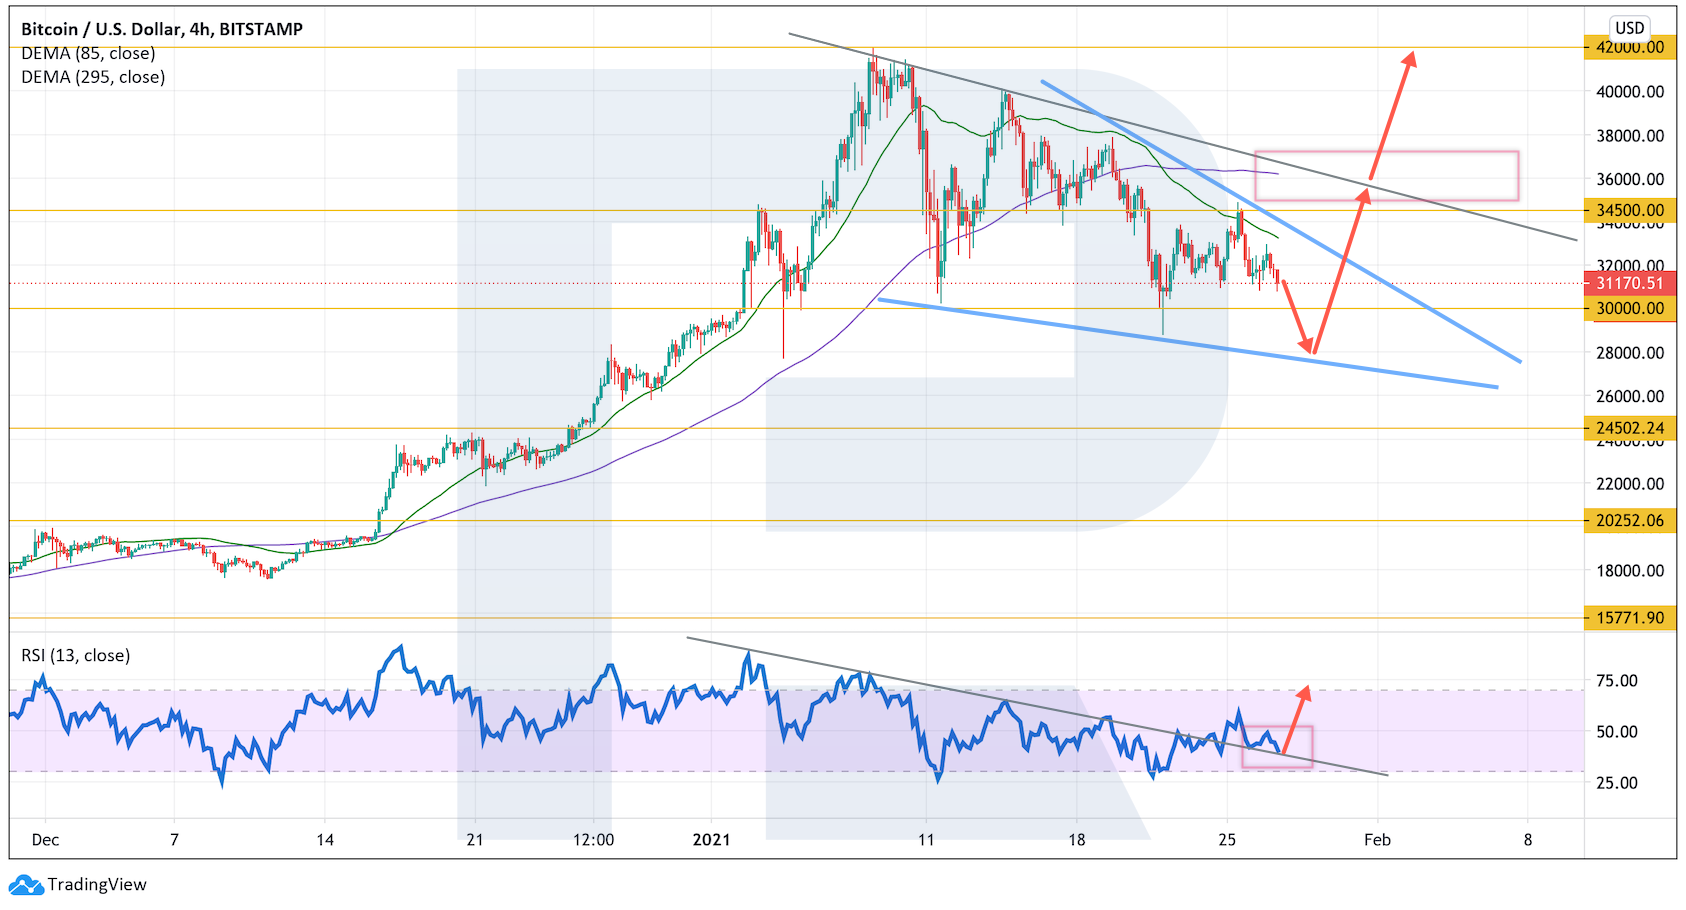
As we can see in the H4 chart, the RSI has broken the descending trendline for the first time since the correction started from $42,000. This might be a signal that the correction is over and the price is about to resume growing. In this case, the closest upside target will be at $34,500. Still, there might be an alternative scenario, according to which the asset may move within a Wedge reversal pattern and test its downside border at $28,000. On the other hand, if the instrument breaks the pattern’s upside border and fixes above $32,500, it may continue growing to reach $42,000 within the frameworks of the pattern materialization.
By Dmitriy Gurkovskiy, Chief Analyst at RoboForex
Disclaimer
Any predictions contained herein are based on the author’s particular opinion. This analysis shall not be treated as trading advice. RoboForex shall not be held liable for the results of the trades arising from relying upon trading recommendations and reviews contained herein.
Disclaimer: This trading analysis is provided by a third party, and for informational purposes only. It does not reflect the views of Crypto Daily, nor is it intended to be used as legal, tax, investment, or financial advice.
Related TAGS:
You can share this post!
Source: Read Full Article


