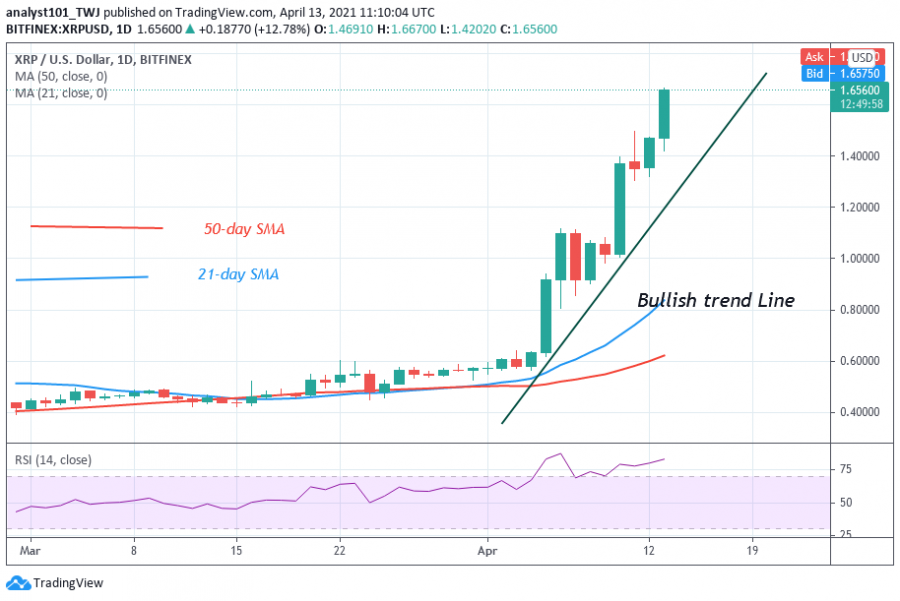
Buyers have broken the former resistance level at $1.10 as price rallied to $1.68. Ripple price is making a series of higher highs and higher lows. On April 11, buyers made a pullback at a higher high of $1.496.
Ripple resumed upside momentum when buyers broke the $1.50 resistance. XRP is expected to rally to the high of $2.0 if buyers are successful. XRP/USD is now trading at $1.68 at the time of writing. However, further upside momentum is doubtful as the market reaches the overbought region. Nevertheless, if Ripple turns down from the recent high, XRP will fall and resume correction above the $1.40 support.
Ripple indicator analysis
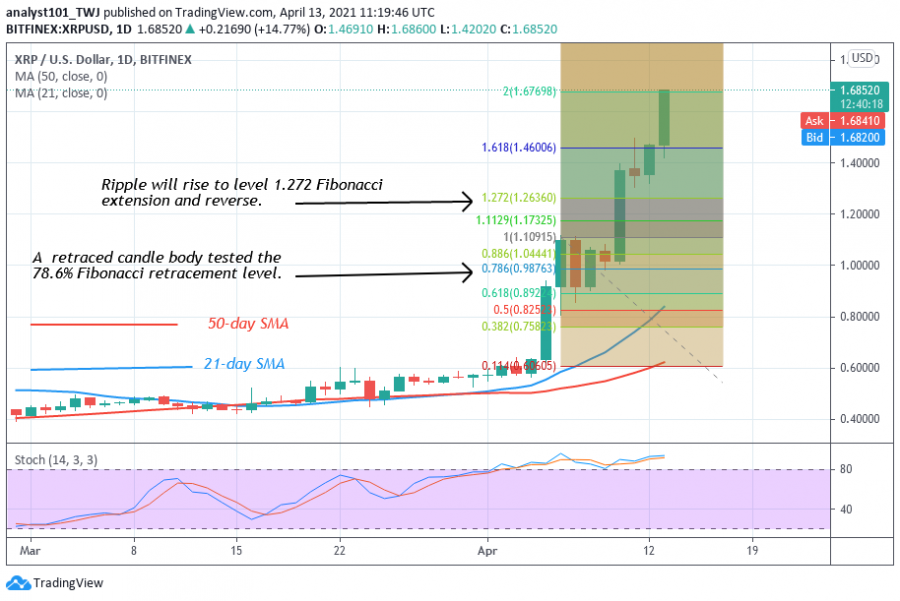
Ripple is above 90% range of the daily stochastic. It indicates that the bulls have much control of price as the market reaches the overbought region. The altcoin is at level 83 of the Relative Strength Index period 14. There is every indication that sellers will emerge to push prices down. Ripple will continue to rise as long as the bullish trend remains unbroken.
Technical indicators:
Major Resistance Levels – $1.95 and $2.0
Major Support Levels – $0.60 and $0.55
What is the next move for Ripple?
Ripple is in a tremendous upward move. The Fibonacci tool has indicated an upward move of the altcoin. Nonetheless, the price action has surpassed this level. Nevertheless, on April 6 uptrend; a retraced candle body tested the 78.6% Fibonacci retracement level. This retracement gives the impression that XRP will rise to level 1.272 Fibonacci extensions or the high of $1.26. Today, Ripple price has risen to $1.68 and it is expected to reach a high of $2.0.
Disclaimer. This analysis and forecast are the personal opinions of the author are not a recommendation to buy or sell cryptocurrency and should not be viewed as an endorsement by CoinIdol. Readers should do their own research before investing
Source: Read Full Article


