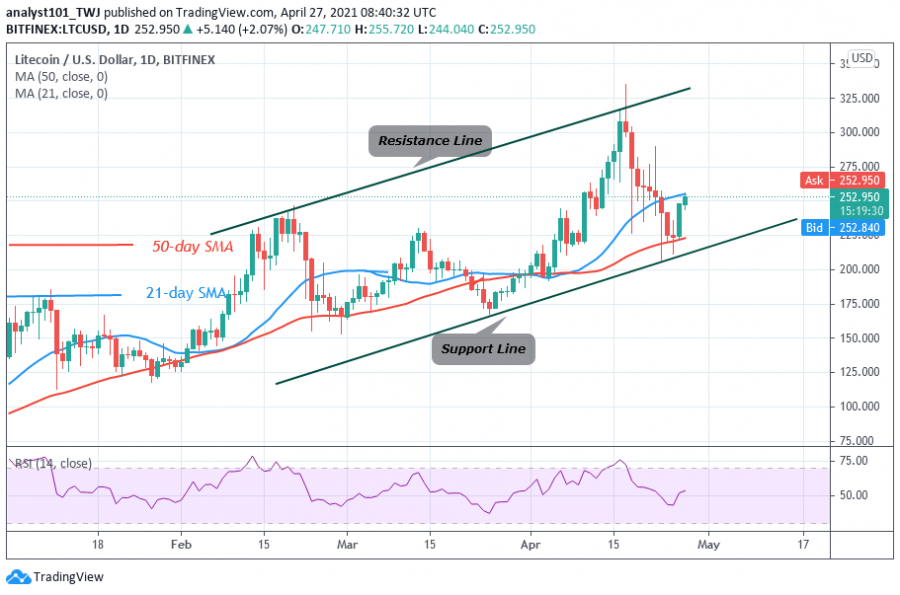
Litecoin's downward move reached bearish exhaustion as the altcoin fell and found support above the $210 price level. LTC price rebounded above $210 support and rallied to $255 high.
LTC/USD is retracing after rejection from the recent high. The current downtrend was stalled by buyers at the $210 support level.
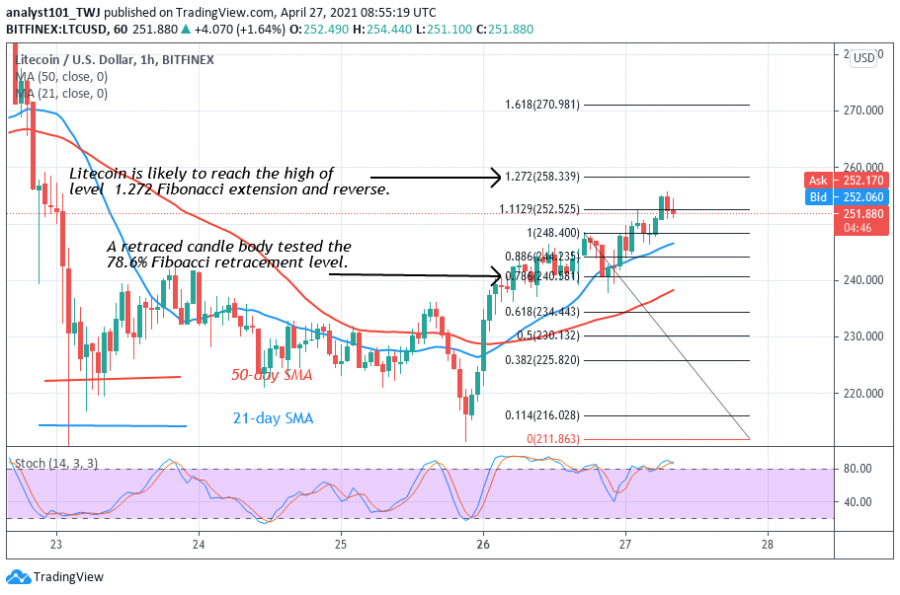
The altcoin brief uptrend is facing rejection at the recent high. The implication is that selling pressure may resume. However, if the selling pressure resumes and breaks the $210 support, the market will decline to $168. On the other hand, if price retraces and finds support above $240, the upside momentum will resume. LTC price will rise and retest the highs of $280 and $320. In meantime, Litecoin is trading marginally at $251.89 at the time of writing.
Litecoin indicator analysis
Litecoin price is above the 50-day SMA but faces rejection at the 21-day SMA. The altcoin will resume upward if the price breaks above the moving averages. LTC price is at level 53 of the Relative Strength Index period 14. It indicates that the market is now in the uptrend zone and the altcoin has room to rally on the upside.
Technical indicators:
Major Resistance Levels – $262 and $264
Major Support Levels – $200 and $198
What is the next move for Litecoin?
Litecoin is in a brief uptrend after it finds support above the $210 support. The LTC/USD is falling after reaching the recent high. On April 26 uptrend; a retraced candle body tested the 78.6% Fibonacci retracement level. This retracement indicates that the market will rise to 1.272 Fibonacci extensions and reverse. From the price action, LTC has revered close to the Fibonacci extension level. The reversal is that it will return to a 78.6% Fibonacci retracement level.
Disclaimer. This analysis and forecast are the personal opinions of the author and not a recommendation to buy or sell cryptocurrency and should not be viewed as an endorsement by CoinIdol. Readers should do their own research before investing funds.
Source: Read Full Article


