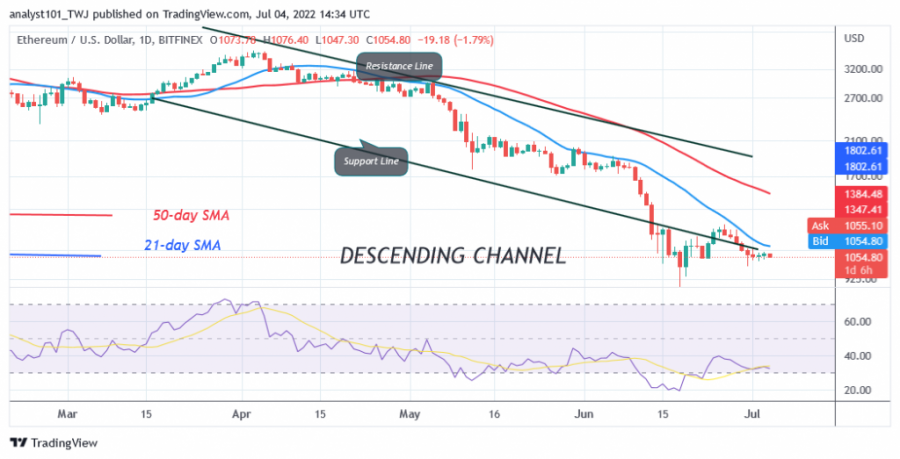
Ethereum (ETH) is in a downward correction as buyers continue to defend the psychological $1,000 price level. Bulls bought the dips after the June 30 plunge, but the upside move was slowed by bear selling on the July 1 rally.
After that, the Ether price continued to trade above the psychological price level of $1,000. Today, the bears are trying to break the current support. If the bears succeed, the Ether price will fall to the low of $881. Bearish momentum will extend to $600. if selling pressure continues. On the other hand, if Ether holds above the $1,000 support, there is a tendency for the rally. A price rebound will drive ETH to the $1,703 high. In the meantime, bulls are holding the current support while the market continues its fluctuations.
Ethereum indicator analysis
Ether is at level 31 of the Relative Strength Index for period 14, and the RSI is stable as the altcoin moves above the psychological price level of $1,000. The price of the cryptocurrency is below the 40% range of the daily stochastic. The market is in a bearish momentum. The 21-day line SMA and the 50-day line SMA are sloping south, indicating a downtrend. The 21-day line SMA is the resistance line for the price bars.
Technical indicators:
Major Resistance Levels – $2,000 and $2,500
Major Support Levels – $1,000 and $500
What is the next direction for Ethereum?
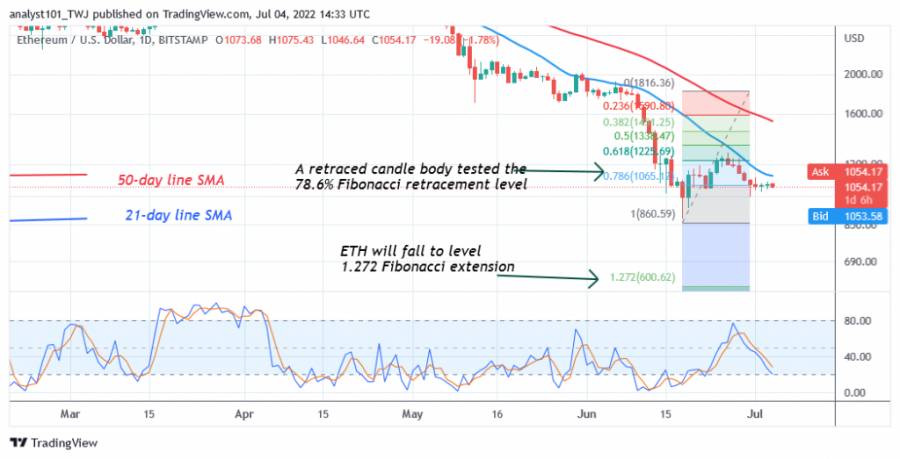
Ether is prone to downside as it trades in the bearish trend zone. Upsides have been limited by the 21-day line SMA as Ether trades above the $1,000 psychological price level. Meanwhile, on June 18 downtrend, a retraced candle body tested the 78.6% Fibonacci retracement level. The retracement suggests that ETH will fall, but reverse at the level of 1,272 Fibonacci extension or $600.
Disclaimer. This analysis and forecast are the personal opinions of the author and are not a recommendation to buy or sell cryptocurrency and should not be viewed as an endorsement by CoinIdol. Readers should do their research before investing funds.
Source: Read Full Article


