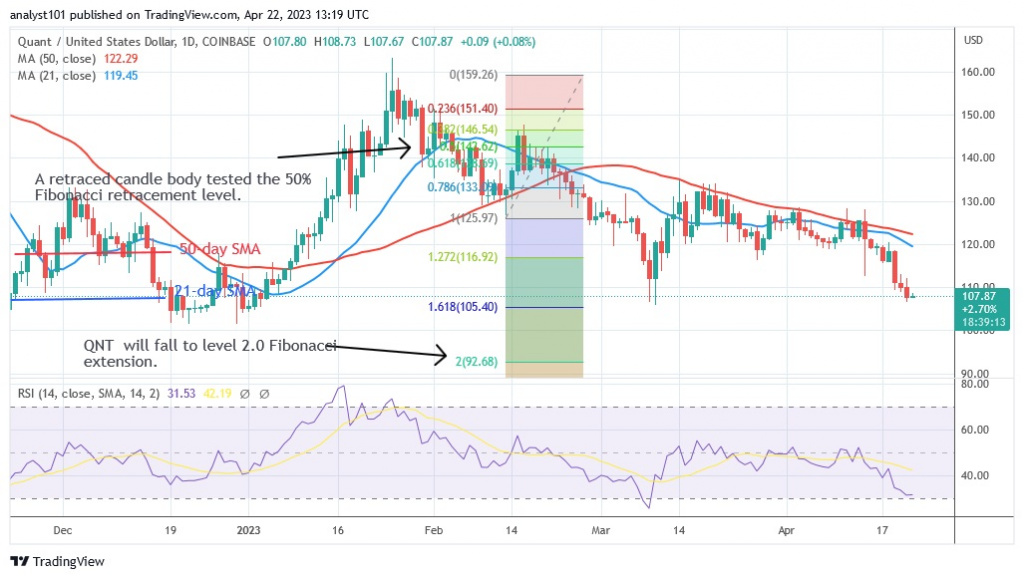
The price of Quant (QNT) has been falling slowly as it approaches its previous low of $106. There has not been much buying pressure.
Quant long term price forecast: bearish
The crypto asset has been regularly rejected at the $130 threshold. QNT has risen to its previous low and is now trading at $108.06. The altcoin tested the previous low before pulling back. The cryptocurrency asset will be forced to move within a certain range if the existing support holds. The price of QNT will now be between $106 and 120. The Fibonacci analysis, on the other hand, will hold if the bears exceed the previous low. This includes the possibility of QNT/USD falling to the Fibonacci extension level 2.0 or $92.68. The cryptocurrency asset is currently challenging the previous low.
Quant price indicator analysis
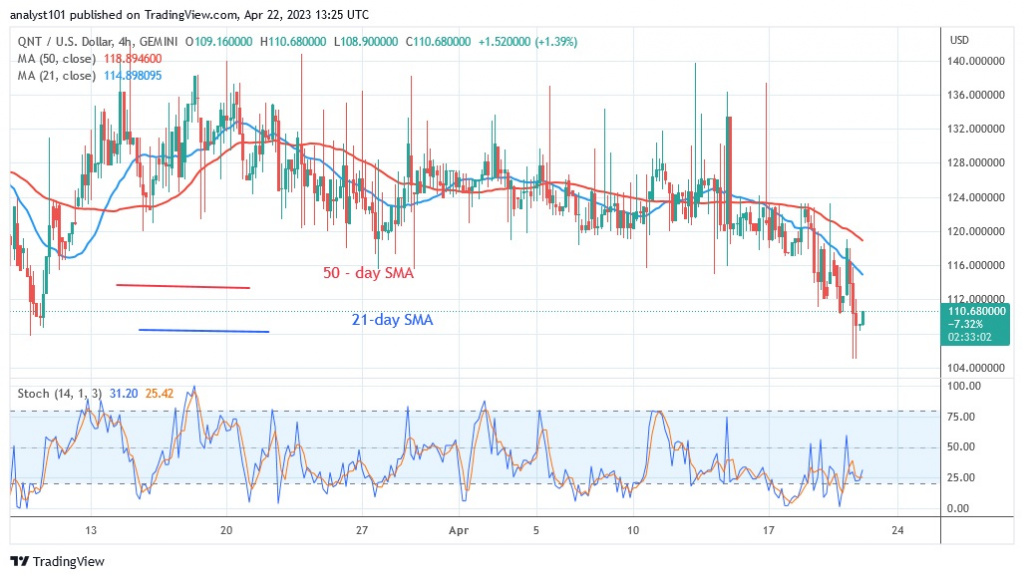
Quant’s Relative Strength Index is at 32 for the period of 14. The oversold area of the market is being approached by the cryptocurrency. The current decline is due to the price bars being below the moving average lines. Although the altcoin is in the oversold area of the market, it is correcting above the daily Stochastic threshold of 25.
Technical indicators
Key supply zones: $140, $150, $160
Important demand zones: $120, $110, $100
What is the next step for Quant?
Quant has been in a downtrend since April 14. The altcoin has already reached its previous low and could fall even further. Bullish candlesticks are forming as buyers try to protect the current support. If the bears manage to break the current support, selling pressure will increase.
Disclaimer. This analysis and forecast are the personal opinions of the author and are not a recommendation to buy or sell cryptocurrency and should not be viewed as an endorsement by CoinIdol. Readers should do their own research before investing in funds.
Source: Read Full Article


