A Retest of $28k is Probable for Bitcoin, so is a Move Back to $32k
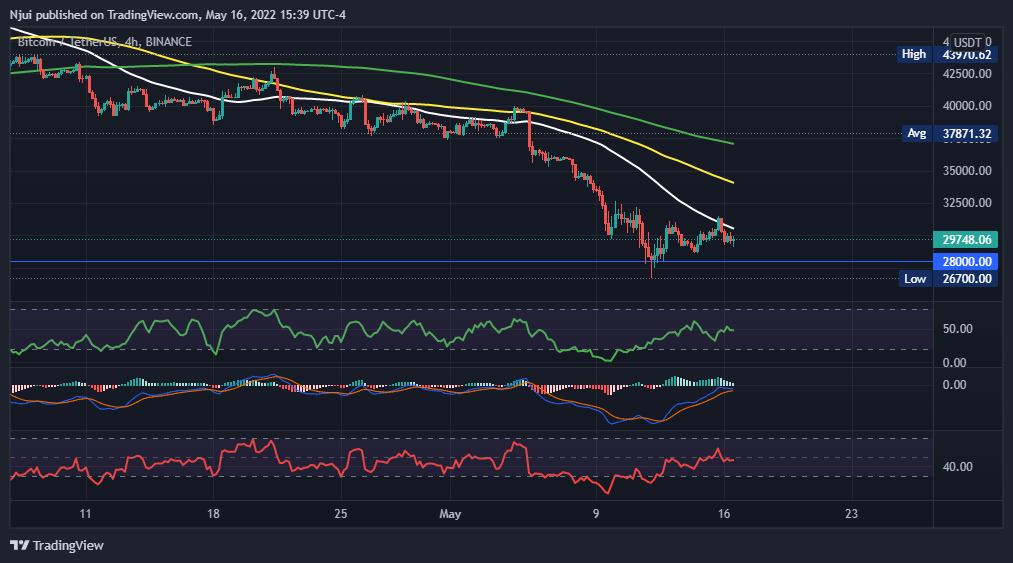
The 4-hour BTC/USDT chart below further confirms Bitcoin’s stability in the last week as it ranges between the local low of $26,700 and the $32k resistance level. Also, from the chart, it can be observed that Bitcoin’s next move is somewhat unclear as its MFI and RSI are in the neutral territory of 50 and 48, respectively.
Bitcoin’s MACD on the 4-hour chart is exhibiting some signs of weakness, with its histograms confirming a reduction in buying activity. Consequently, Bitcoin could retest the $28k support level if buyers do not step up to the plate.
At the same time, Bitcoin is attempting to recapture the 4-hour 50 moving average (white) as support that could open the doors to a push towards $32k.
Therefore, a wait-and-see approach might be the best course of action for the next 24 or 48 hours, given the mixed signals being exhibited by Bitcoin on the 4-hour chart.
[Feature image courtesy of Unsplash.com]
Source: Read Full Article


