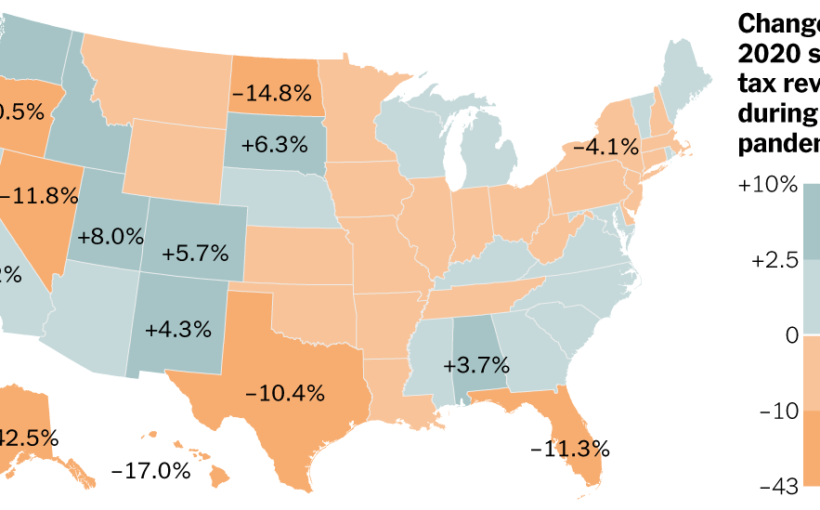
Grim forecasts held up for a few states, but many took in about as much tax revenue as before the pandemic — sometimes a lot more.
Change in state tax revenue
–42.5%
–10.0%
0
+10.5%
+2.5%
The change in tax revenue during the “pandemic period,”
April through December 2020, compared
to the same period in 2019
+2.5%
–14.8%
–10.5%
+6.3%
–4.1%
+10.4%
–11.8%
+8.0%
+5.7%
+1.2%
+4.3%
+3.7%
–10.4%
–42.5%
–11.3%
–17.0%
Change in state tax revenue
–42.5%
–10.0%
0
+2.5%
+10.5%
The change in tax revenue during the “pandemic period,”
April through December 2020, compared to the same period in 2019
+2.5%
+2.2%
–14.8%
–5.6%
+2.2%
–10.5%
–2.5%
–2.0%
–2.8%
+0.5%
+10.4%
+6.3%
–4.1%
–2.5%
–8.5%
+0.8%
+0.3%
–3.1%
–2.0%
–2.4%
+0.7%
–0.9%
+0.1%
–11.8%
–2.4%
–7.3%
+8.0%
–2.0%
+5.7%
+1.2%
–4.3%
+1.2%
–2.7%
–2.7%
+1.5%
+2.1%
–1.3%
–4.0%
+2.4%
–0.2%
+1.7%
+4.3%
+1.9%
+3.7%
+0.3%
–10.4%
–7.5%
–42.5%
–11.3%
–17.0%
Change in state tax revenue
–42.5%
–10.0%
0
+2.5%
+10.5%
Wash.
The change in tax revenue during the
“pandemic period,” April through
December 2020, compared to
the same period in 2019
+2.5%
Me.
N.D.
Mont.
+2.2%
–14.8%
–5.6%
+2.2%
Ore.
Vt.
Minn.
–10.5%
N.H.
–2.5%
–2.0%
Mass.
Wis.
Idaho
S.D.
N.Y.
–2.8%
+0.5%
+10.4%
+6.3%
–4.1%
Wyo.
Mich.
R.I.
+0.8%
–8.5%
+0.3%
Conn.
–2.5%
Pa.
Iowa
–3.1%
Neb.
–2.0%
–2.4%
N.J.
+0.7%
Ohio
Nev.
Ind.
–0.9%
Ill.
Utah
–7.3%
Del.
–11.8%
–2.4%
–2.0%
+8.0%
Md.
+0.1%
Colo.
Calif.
W.Va.
Va.
+5.7%
Kan.
+1.2%
–4.3%
Mo.
+1.2%
Ky.
–2.7%
–2.7%
+1.5%
N.C.
+2.1%
Tenn.
–1.3%
Okla.
Ariz.
Ark.
–4.0%
+2.4%
S.C.
N.M.
–0.2%
+1.7%
+4.3%
Miss.
Ala.
Ga.
+0.3%
+3.7%
+1.9%
Tex.
La.
–10.4%
–7.5%
Alaska
–42.5%
Fla.
–11.3%
Hawaii
–17.0%
Source: Urban-Brookings Tax Policy Center
By Mary Williams Walsh
Graphics by Karl Russell
Throughout the debate over stimulus, one question has produced repeated deadlock in Washington: should the states get no-strings federal aid?
Republicans have mostly said no, casting it as a bailout for spendthrift blue states. Democrats have argued the opposite, saying that states face dire fiscal consequences without aid. State aid could well be a stumbling block for President Biden’s $1.9 trillion federal stimulus bill, which contains $350 billion in relief for state and local governments and narrowly passed the House this past weekend. It faces a much tougher fight in the Senate.
As it turns out, new data shows that a year after the pandemic wrought economic devastation around the country, forcing states to revise their revenue forecasts and prepare for the worst, for many the worst didn’t come. One big reason: $600-a-week federal supplements that allowed people to keep spending — and states to keep collecting sales tax revenue — even when they were jobless, along with the usual state unemployment benefits.
By some measures, the states ended up collecting nearly as much revenue in 2020 as they did in 2019. A J.P. Morgan survey called 2020 “virtually flat” with 2019, based on the 47 states that report their tax revenues every month, or all except Alaska, Oregon and Wyoming.
A researcher at the Urban-Brookings Tax Policy Center, a nonpartisan think tank, compared April through December 2020 and found total state revenues down just 1.8 percent compared with the same period in 2019. Moody’s Analytics used a different method and found that 31 states now had enough cash to fully absorb the economic stress of the pandemic recession on their own.
“You can see it’s just a completely different story this time,” said Louise Sheiner, a Brookings Institution economist whose research showed that over all, the states struggled far less during the pandemic than in previous recessions.
+15
%
State and local tax revenue in 2020
+10
Property tax
+5
State
income tax
0
Total
state tax
–5
State
sales tax
Year-over-year changes in
12-month moving averages
–10
Jan.
2020
March
May
July
Dec.
Change in state and local revenues
+4
%
+2
Coronavirus
pandemic
0
–2
–4
Great
recession
–6
–8
1
2
3
4
5
6
7
8
Year relative to the start of the recessions
+15
%
State and local tax revenue in 2020
+10
Property tax
+5
State income tax
0
Total
state tax
–5
State
sales tax
Year-over-year changes in
12-month moving averages
–10
Jan.
2020
March
April
May
June
July
Dec.
+4
%
Change in state and local revenues
+2
Coronavirus
pandemic
0
–2
–4
Great
recession
–6
–8
1
2
3
4
5
6
7
8
Year relative to the start of the recessions
+15
%
+4
%
State and local tax revenue in 2020
Change in state and local revenues
+2
+10
Coronavirus
pandemic
0
Property tax
+5
–2
State income tax
0
–4
Total
state tax
Great
recession
–5
–6
State
sales tax
Year-over-year changes in
12-month moving averages
–10
–8
Jan.
2020
March
April
May
June
July
Dec.
1
2
3
4
5
6
7
8
Year relative to the start of the recessions
Note: Figures do not include federal transfers.
Sources: Urban Institute, the Census Bureau and the Bureau of Economic Analysis, via Louise Sheiner (Brookings Institution)
New Jersey, for instance, managed to avoid financial calamity despite a dire forecast when the pandemic started, because of better-than-expected tax revenue from retail sales and high earners, who lost fewer jobs and reaped the benefits of a bullish stock market. However, it still had to borrow $4 billion in emergency relief.
The findings are being cited by Republican lawmakers. In a Feb. 2 blog post, House Minority Leader Kevin McCarthy, Republican of California, said the J.P. Morgan report was evidence that the states were doing just fine. He called on Democrats not to insist on “blue-state slush funds that are not needed.”
At the same time, Democrats have said states need relief even if their revenues are resilient, because their costs will spiral as schools reopen and vaccination programs roll out.
Source: Read Full Article


