Yesterday, Bitcoin Cash (BCH) rose to a high of $731 and then reversed. Today BCH has retraced to a low of $685 and has started a new uptrend.
Bitcoin Cash Price Long Term Analysis: Bearish
During the initial uptrend, buyers attempted to recapture the previous price level of $800. The previous price level was reached on September 6, but buyers faced fierce rejection at the recent high.
Today, buyers have begun a new uptrend to break above resistance at $731. A break above current resistance will drive price towards the high at $800. However, the bullish momentum is unlikely to last as the market has reached the overbought area. However, if the overbought area holds, BCH will be rejected at the $800 high.
Bitcoin Cash indicator display
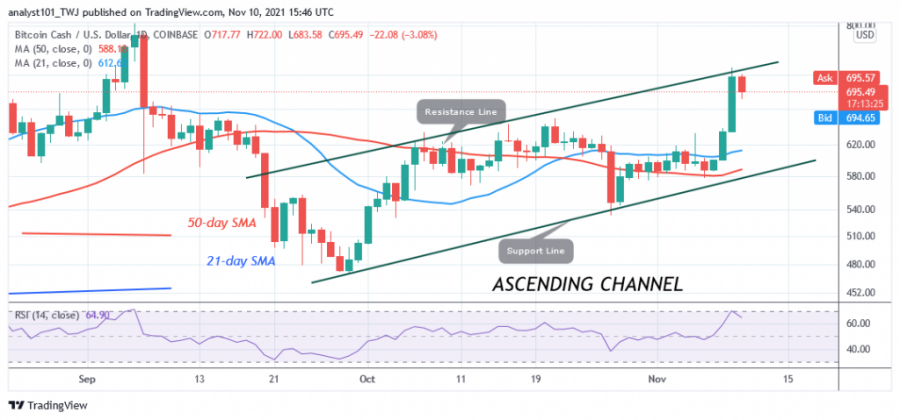
The recent retracement has seen the altcoin reach level 65 on the Relative Strength Index for period 14. The uptrend will continue if the price finds support above $680. Also BCH will rise if the price breaks the resistance line of the ascending channel and closes above it. BCH is below the 80% area of the daily stochastics. However, the stochastic bands are sloping upwards, indicating an uptrend.
Technical Indicators
Key resistance zones: $800, $820, $840
Key support zones: $500, $480, $460
What is the next move for Bitcoin Cash (BCH)?
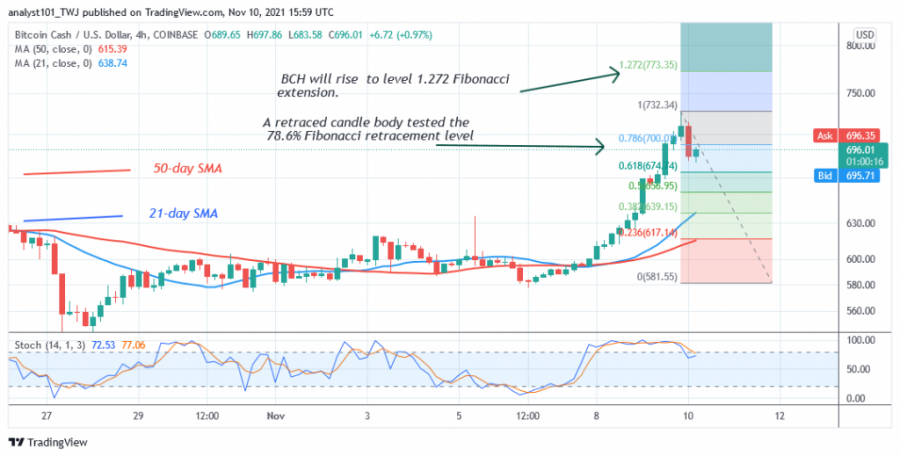
Bitcoin Cash has completed a pullback to the downside. The retracement has eased as the price has found support above $680. Meanwhile, on November 9, a retracement candlestick tested the 78.6% Fibonacci retracement level. This retracement suggests that BCH will rise but reverse at the 1,272 Fibonacci extension or at $773.35.
Disclaimer. This analysis and forecast is the personal opinion of the author and does not constitute a recommendation to buy or sell cryptocurrencies and should not be considered an endorsement of Coin Idol. Readers should do their own research before investing any money.
Source: Read Full Article


