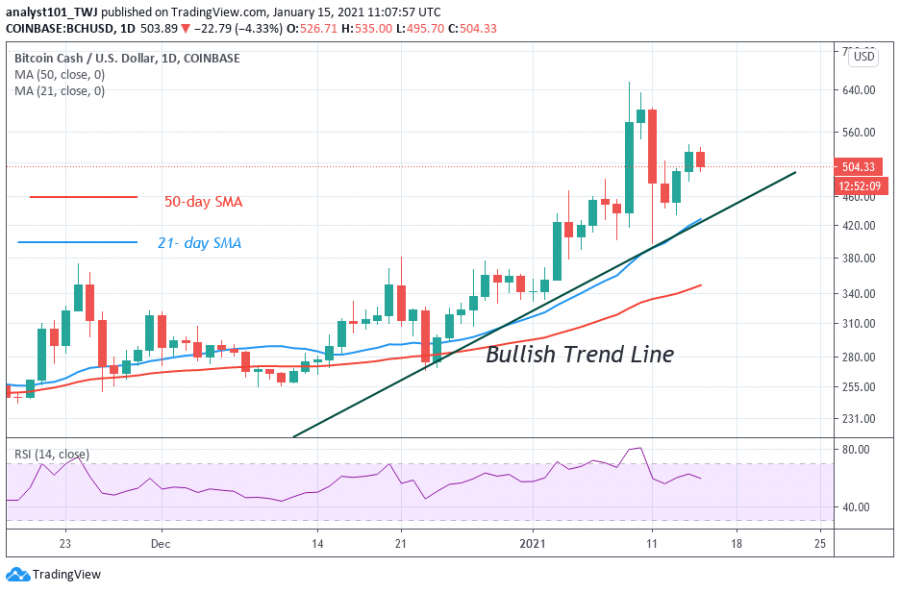
Bitcoin Cash is falling after reaching the $540 resistance zone. For BCH to turn down from the recent high is an indication of resuming a range-bound movement for a few days.
The price is likely retraced to the low of $430 before resuming the sideways move. Alternatively, the coin will continue to fluctuate below the resistance zone.
Yesterday, the second upward was short-lived as the bulls were resisted at the $540 resistance zone. On the upside, if the bulls have broken the $540 resistance, the market will rally and retest the $650 high. BCH will resume its upside momentum and the $1,000 price level if the $650 high is breached. On the downside, the crypto may resume fluctuation between $430 and $540 before a resumption of upside momentum.
Bitcoin Cash indicator reading
The crypto’s price falls and rebounds above the trend line. It indicates a strong buying pressure above the trend line. On the other hand, if the price breaks below the trend line, it indicates a possible change in the trend. The coin is at level 60 of the Relative Strength Index period 14. The crypto is in the uptrend zone and it is likely to rise.
Key Resistance Zones: $440, $480, $520
Key Support Zones: $200, $160, $120
What is the next move for Bitcoin Cash?
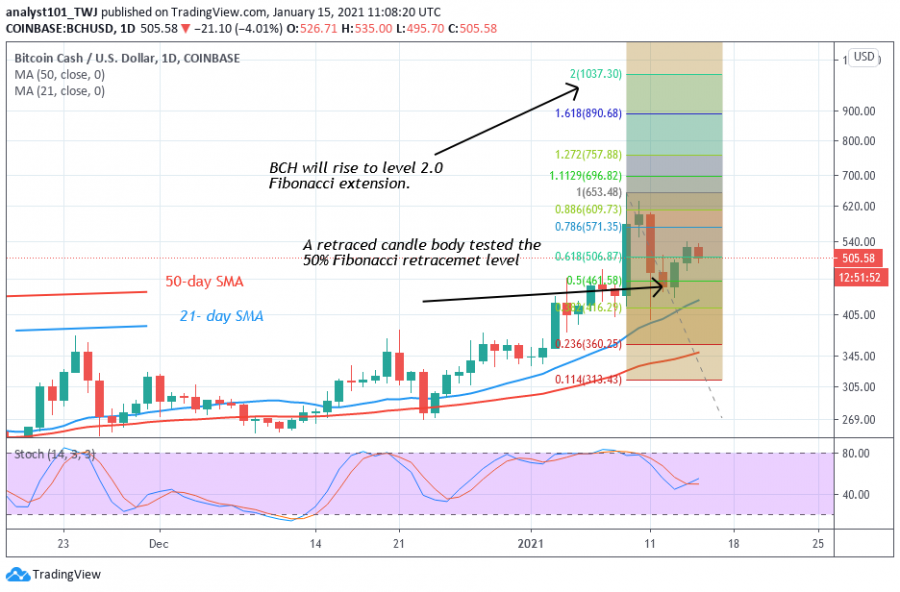
Bitcoin Cash has resumed a fresh uptrend after the recent breakdown. On January 10 uptrend; the retraced candle body tested the 50% Fibonacci retracement level. The retracement indicates that BCH is likely to rise to level 2.0 Fibonacci extensions. In other words, BCH will rise to a high of $1037.30.
Disclaimer. This analysis and forecast are the personal opinions of the author that are not a recommendation to buy or sell cryptocurrency and should not be viewed as an endorsement by Coin Idol. Readers should do their own research before investing funds.
Source: Read Full Article


