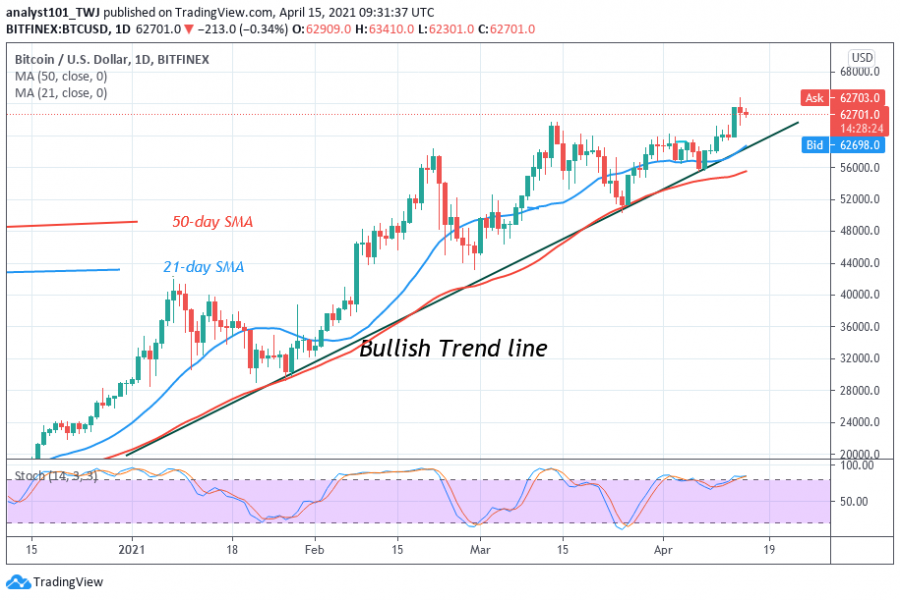
BTC/USD is fluctuating above the $62,000 support after its recent rejection from the $65,000 high. Presently, Bitcoin has commenced the resumption of an uptrend after breaching the resistances at $60,000 and $61,825.
These resistance levels bought interruption to the current uptrend for over a month. The recent breakout resulted in a brief rally to the $65,000 high.
Buyers could not penetrate the $65,000 resistance zone as price fell to $62,000 support. The uptrend will resume if the current support holds. Buyers will attempt to push the BTC price above the $65,000 resistance. If successful a rally above $70,000 is likely. Nevertheless, if price fluctuates and breaks below the $62,000 support, Bitcoin will decline to the $60,000 psychological price level. Meanwhile, Bitcoin is trading at $62,492.0 at the time of writing.
Bitcoin indicator reading
Bitcoin’s uptrend has been consistent despite price retracement. BTC price is retracing to the support of the 21-day SMA. If the 21-day SMA or 50-day SMA support holds, the market will resume upside momentum. Similarly, since the commencement of the uptrend, the bullish trend line has not been broken. However, if the BTC price retraces and closes below the trend line, the uptrend may be terminated.
Technical indicators:
Major Resistance Levels – $65,000 and $70,000
Major Support Levels – $50,000 and $48,000
What is the next direction for BTC/USD?
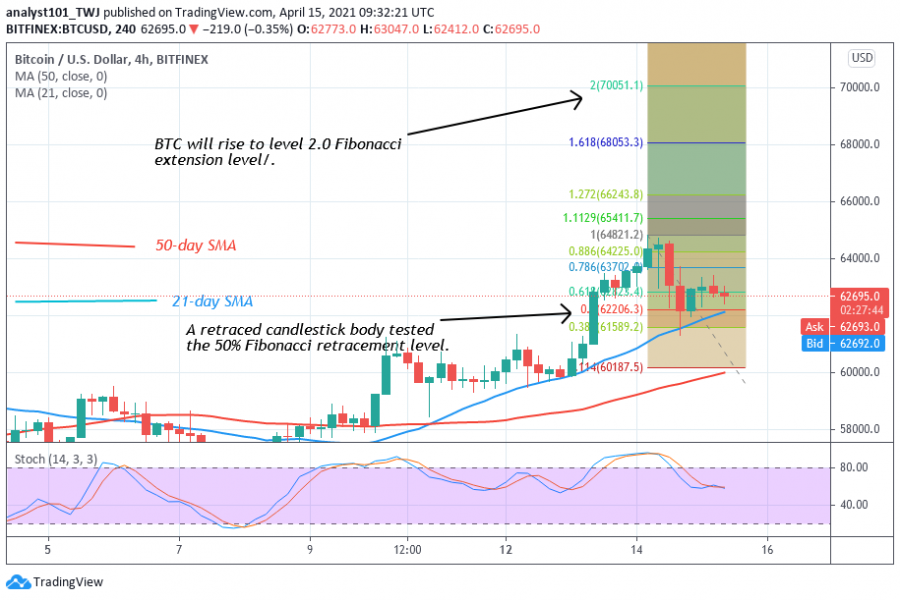
BTC price is consolidating above the $62,000 support. The Fibonacci tool has indicated an upward movement of Bitcoin. Meanwhile, on April 14 uptrend; a retraced candle body tested the 50% Fibonacci retracement level. This retracement indicates that Bitcoin will rise to level 2.0 Fibonacci extension or the high of $70,051.10.
Disclaimer. This analysis and forecast are the personal opinions of the author that are not a recommendation to buy or sell cryptocurrency and should not be viewed as an endorsement by CoinIdol. Readers should do their own research before investing funds.
Source: Read Full Article


