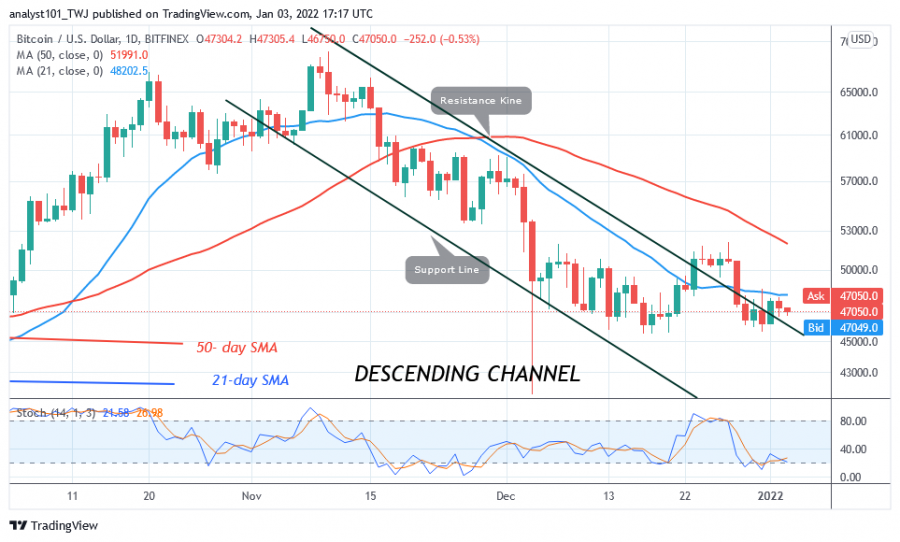
Bitcoin (BTC) price is in a downward correction and above the crucial support line. Bitcoin's upward movement has been capped below the psychological $50,000 price level.
Since September 29, BTC has been hovering between $46,000 and $48,000. Today, the BTC price seems to be falling marginally into the lower price range.
The bottom line is that Bitcoin will see a rally or collapse if it continues to trade in a tight range. Thus, a sharp rise above the current support will push the BTC price to break through the initial resistance and rise above the overarching $52,000 resistance. The bullish momentum will extend to the high at $54,000. Conversely, a break below support at $46,000 will cause the bitcoin price to fall drastically to the low of $41,634. Meanwhile, the cryptocurrency is trading at $46,979 as of press time.
Bitcoin indicator reading
BTC’s price bars are below the moving averages of the 21-day line and the 50-day line. This suggests that the market could resume a downward movement. In addition, BTC prices could see a possible breakout. Bitcoin is below the 50% area of the daily stochastic. This suggests that the market is in a bearish momentum.
Technical indicators:
Major Resistance Levels – $65,000 and $70,000
Major Support Levels – $40,000 and $35,000
What is the next direction for BTC?
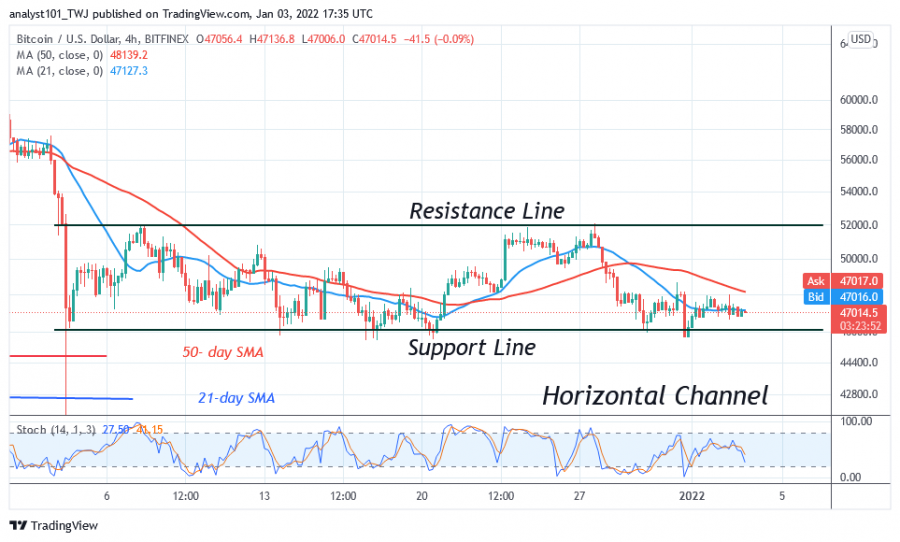
On the 4-hour chart, bitcoin is in a range-bound move. Last month, Bitcoin bulls unsuccessfully tried to keep the price above $52,000. Today, the BTC price is struggling to reach the crucial $46,000 level.
Disclaimer. This analysis and forecast are the personal opinions of the author and are not a recommendation to buy or sell cryptocurrency and should not be viewed as an endorsement by CoinIdol. Readers should do their own research before investing funds.
Source: Read Full Article


