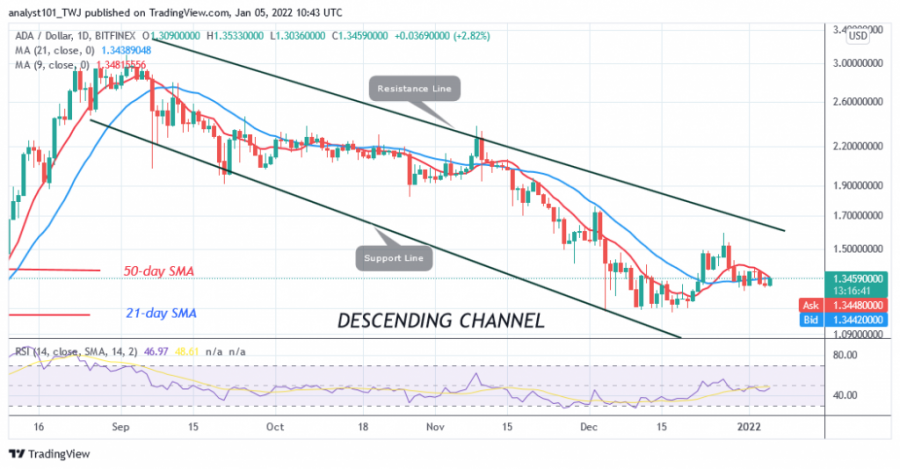
The price of Cardano (ADA) is in a downward correction. On December 31, the cryptocurrency fell below its moving averages.
In the last five days, buyers have been struggling to push the altcoin above the moving averages. Today, the uptrend got stuck below the moving averages. On December 27, the price of ADA rose to a high of $1.60, but buyers could not sustain the upward momentum above the recent high.
The altcoin is trading in the overbought region of the market. On the upside, Cardano will regain bullish momentum if buyers break above the moving averages and resistance at $1.60. At press time, the altcoin is trading at $1.34. Cardano risks another decline if buyers are rejected at the recent high. The market will fall back to the previous low at $1.18.
Cardano indicator analysis
The ADA price is at the 46 level of the Relative Strength Index for the 14 period, which means that the altcoin is in the downward zone and below the 50 centre line. Since the price bars are below the moving averages, the market is essentially vulnerable to a decline. The moving averages of the 21-day line and the 50-day line are horizontally sloped, indicating a sideways trend.
Technical Indicators
Key Resistance Zones: $3.00, $3.50, $4.00
Key Support Zones: $2.50, $2.00, $1.50
What is the next move for Cardano?
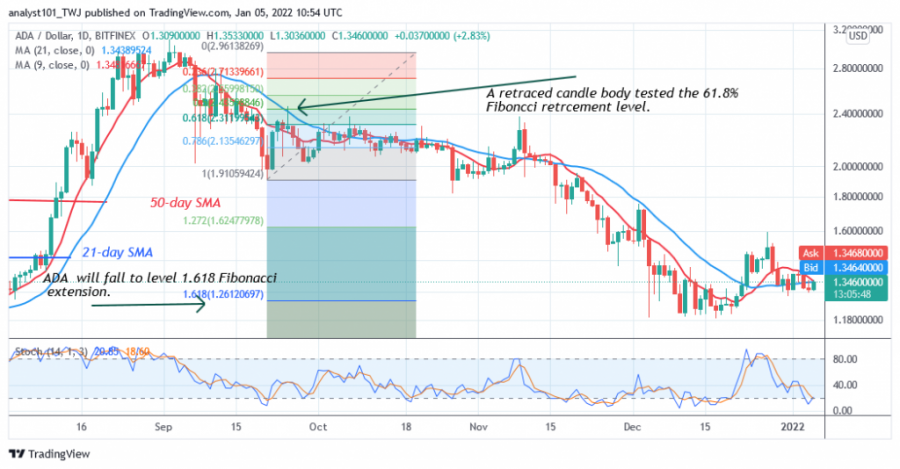
Since the December 4 plunge, Cardano’s price has consolidated above the $1.18 support. The upward correction has been staved off. Meanwhile, on September 21, a candlestick tested the 61.8% Fibonacci retracement level. The retracement suggests that ADA will fall to the Fibonacci extension level of 1.618 or the level of $1.26. The price action shows that the market has been moving around this level.
Disclaimer. This analysis and forecast are the personal opinions of the author and are not a recommendation to buy or sell cryptocurrency and should not be viewed as an endorsement by CoinIdol. Readers should do their own research before investing funds.
Source: Read Full Article


