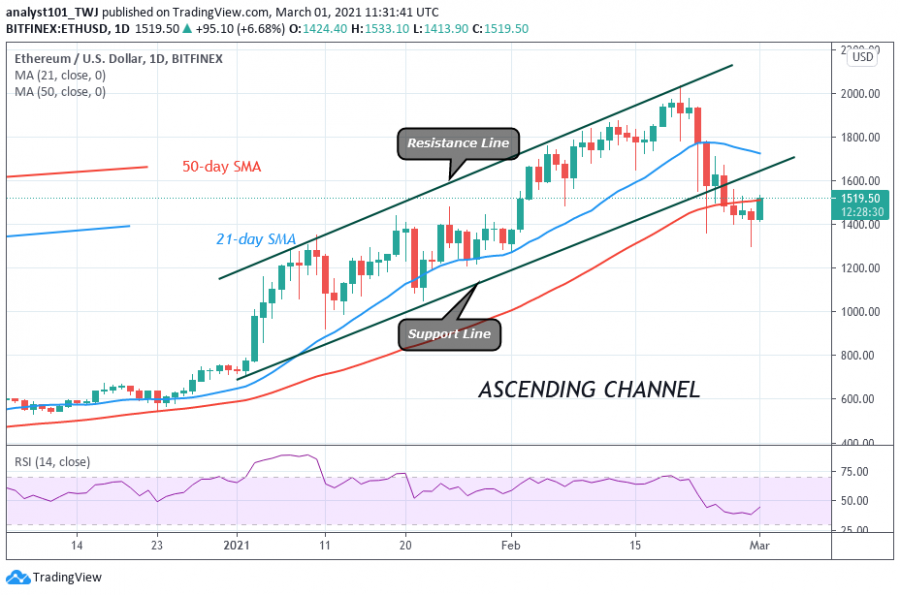
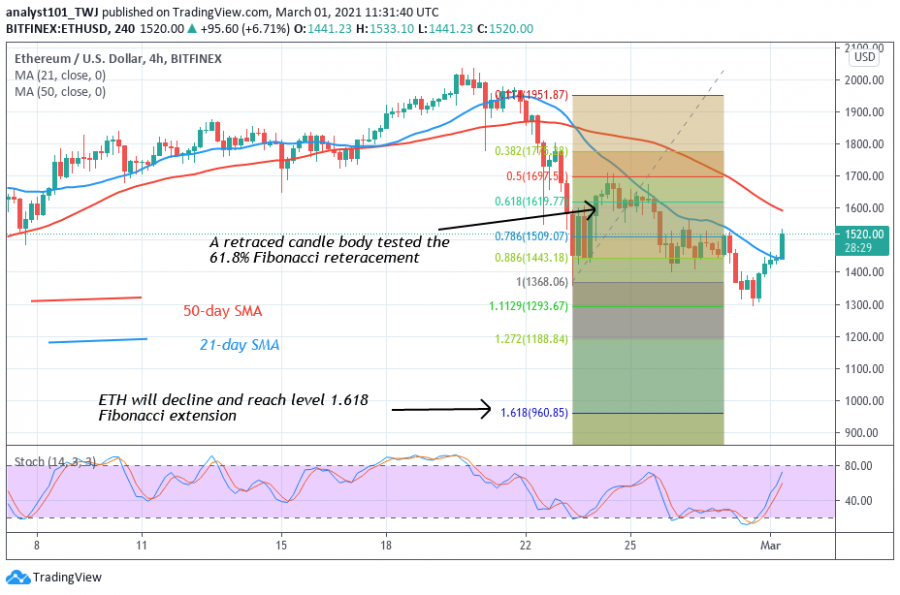
On March 1 Ethereum had risen above $1,500 at the time of writing. The market is likely to rise if the current bullish momentum is sustained but face resistance at the $1,700 high.
Ethereum Price Long-Term Analysis: Bullish
On February 28 the biggest altcoin rebounded above $1,300 support as Ethereum (ETH) commenced the resumption of an upward move. For the past 48 hours, the upward move has been ongoing.
Now Ethereum has all chances to rise above the SMAs; which will propel the altcoin to rise in the bullish trend zone. Besides, a retest at the $2,000 overhead resistance is likely. Conversely, if the bulls fail to break the initial resistance at $1,700, the market will be range-bound between $1,300 and $1,700.
Ethereum Indicator Analysis
Ether’s price is attempting to break above the 50-day SMA. The crypto will resume its upside momentum once price breaks above the 21-day and the 50-day SMAs. The cryptocurrency is at level 44 of the Relative Strength Index period 14. It indicates that the price is in the downtrend zone and below the centerline 50.
Technical indicators:
Major Resistance Levels – $2,500 and $2,700
Major Support Levels – $1.600 and $1,500
What Is the Next Direction for Ethereum?
Ethereum has resumed an upward move as the altcoin rebounded above the $1,300 support. The downtrend would have resumed if the bears broke the current support. The price would have fallen to the lows of $1,200 or $1,000. However, all the indicators have affirmed the upward movement of the coin.
Disclaimer. This analysis and forecast are the personal opinions of the author and not a recommendation to buy or sell cryptocurrency and should not be viewed as an endorsement by CoinIdol. Readers should do their research before investing funds.
Source: Read Full Article


