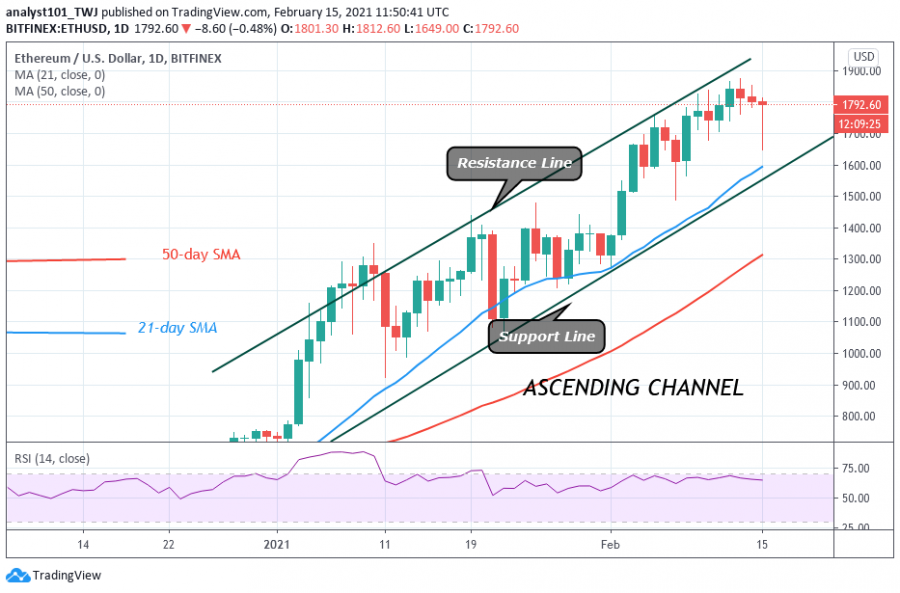
Ethereum is in a downward correction after attaining a new high of $1,874 on February 13. Today, Ether encounters a breakdown while attempting to push above the $1,860 resistance.
The biggest altcoin plunged to $1,649 and pulled back. The bulls bought the dips as Ethereum resumed its upward move. If the price breaks above the SMAs, buyers are likely to retest the resistance levels. On the upside, if the bulls can push the price above the resistance levels, the market will reach a new high of $2,000. The price is currently fluctuating between $1700 and $1,860. Each time buyers attempt the resistance levels; there is always a bearish reaction. The price would fall and find support above $1,700. Ethereum is trading at $1,785 at the time of the writing.
Ethereum indicator analysis
Today, Ether has a candlestick with a long tail. The biggest altcoin has already fallen to $1,649 and pulled back. The long tail indicates that there is strong buying pressure at a lower price level. The cryptocurrency is above the 40% range of the daily stochastic. This indicates that the market has bullish momentum,
Technical indicators:
What is the next direction for Ethereum?
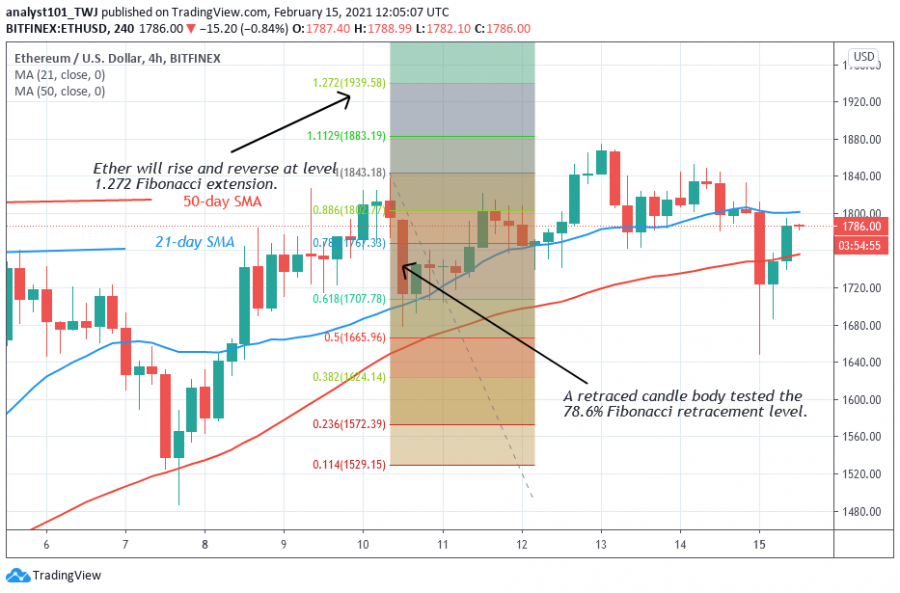
The biggest altcoin has been moving upward consistently. The Fibonacci tool has indicated a possible upward move and reversal at the recent high. The analysis is the same as the market is yet to trend. On February 10 uptrend; a retraced candle body tested the 78.6 % Fibonacci retracement level. This retracement indicates that ETH will rise to level 1.272 Fibonacci extensions or a high of $1,939.58. However, the price will reverse and return to 78.6% Fibonacci retracement where it originated. However, the Reversal will not be immediate.
Disclaimer. This analysis and forecast are the personal opinions of the author and not a recommendation to buy or sell cryptocurrency and should not be viewed as an endorsement by CoinIdol. Readers should do their research before investing funds.
Source: Read Full Article


