Today, Litecoin fell to $135 low and resumed upward. The crypto rebounded above the recent low and resumed a fresh uptrend.
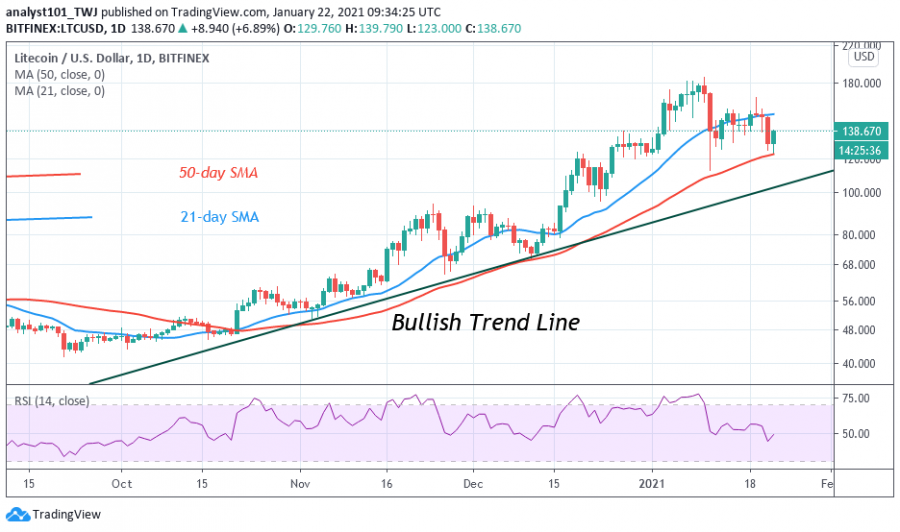
In the first uptrend, LTC attained a peak price of $185 high but the uptrend was repelled in the overbought region. Since January 10, the crypto has been in a downward correction. On January 19, buyers attempted to revisit the peak price but were resisted at the $166 high.
The downtrend resumed to the current support. The crypto is trading at $140 at the time of writing. On the upside, if buyers break the $166 resistance, the coin is likely to rise to retest the $185 overhead resistance. If buyers fail to break the overhead resistance, the coin will fall and resume a range-bound movement between $130 and $160.
Litecoin indicator analysis
The crypto’s price has found support above the 50-day SMA. LTC will resume an upward move if the 50-day SMA support holds. A break below the support will mean a resumption of the downtrend. Nonetheless, if the downtrend continues and breaks below the trend line, the current uptrend may be terminated.
Resistance Levels: $160, $180, $200
Support Levels: $100, $80, $60
What is the next move for Litecoin?
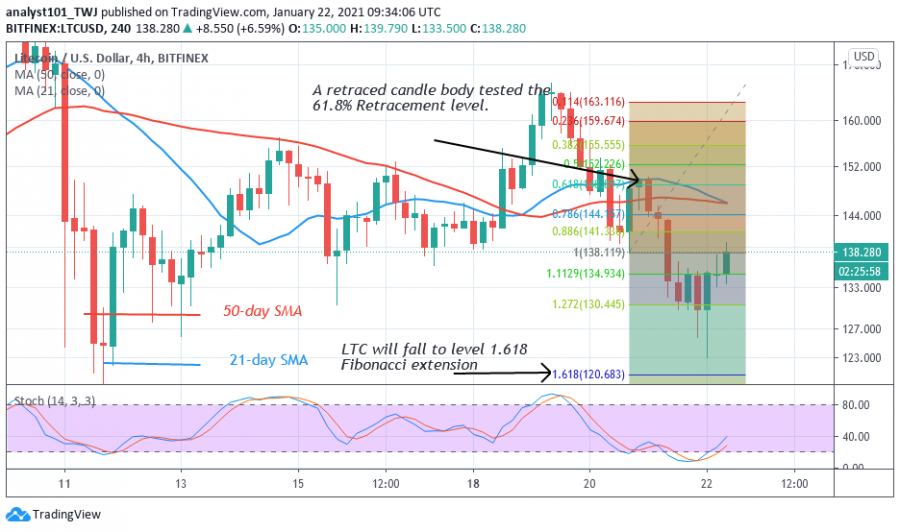
Litecoin has resumed an upward move after falling to $135 low. It appears the support is likely to hold. The Fibonacci tool has earlier indicated a downward movement of the coin. On the January 20 downtrend, a retraced candle body tested the 61.8% Fibonacci retracement level. This gives the impression that the coin will fall to level 1.618 Fibonacci extension level or a high of $120.28. The price action has confirmed the recent low and moved up.
Disclaimer. This analysis and forecast are the personal opinions of the author that are not a recommendation to buy or sell cryptocurrency and should not be viewed as an endorsement by CoinIdol. Readers should do their own research before investing funds.
Source: Read Full Article


