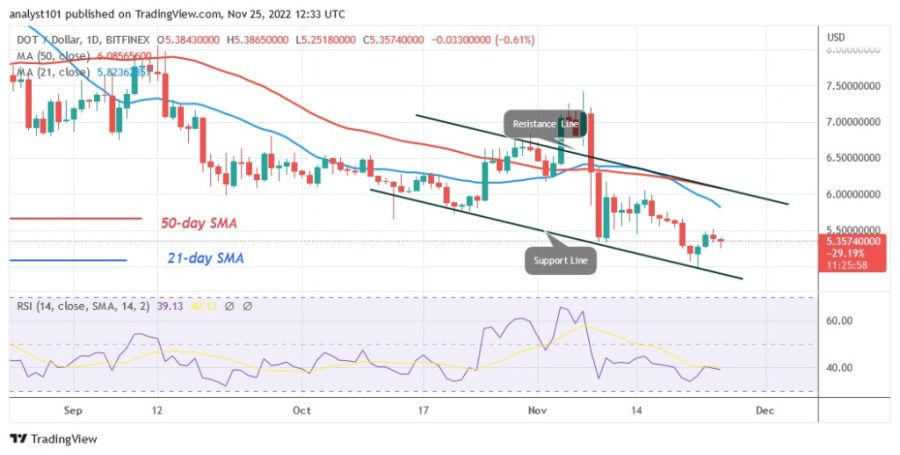
Polkadot (DOT) price is moving sideways again after the recent slump. Since November 9, the price has oscillated between $5.34 and $6.17.
On November 22, sellers broke through support at $5.34, but the bulls recovered the gap.The altcoin was pushed back into the range of fluctuation by buyers. However, the cryptocurrency is driven down by the bears. Buyers tried to push the price up, but were rejected at the high of $5.50. Nevertheless, if the current support is broken, Polkadot will continue to fall to the low of $4.80. If the altcoin regains the $4.80 support, it will either recover or reverse.
Polkadot indicator analysis
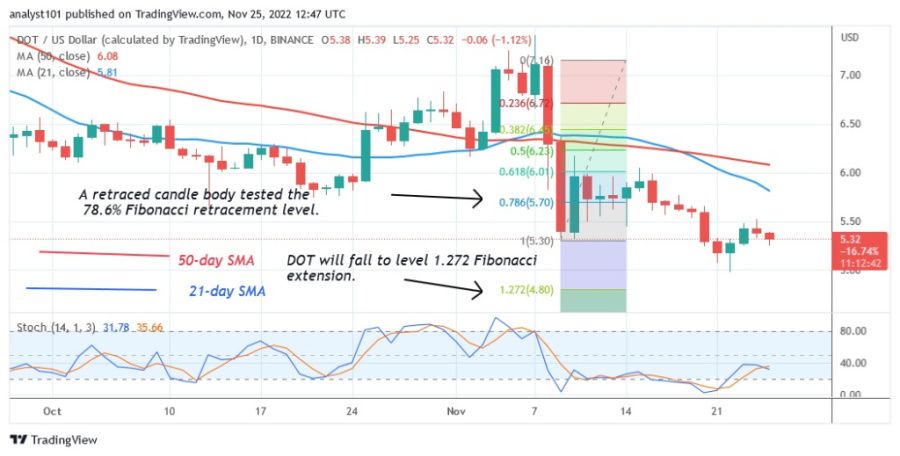
The price of DOT is at the 37 level of the Relative Strength Index for the period 14. As it approaches the oversold area of the market, the altcoin is in a downward movement. The moving average lines are below the price bars, which will lead to a decline in the altcoin. The moving average lines pointing downwards indicate a deterioration. With the daily stochastic below the 40 level, the altcoin is experiencing bearish momentum.
Technical Indicators
Key resistance levels – $10 and $12
Key support levels – $6 and $4
What is the next direction for Polkadot?
After rejecting the high at $5.50, Polkadot is in a downtrend. The price of DOT completed an upward correction during the November 9 downturn and a candlestick tested the 78.6% Fibonacci retracement line. After the correction, the price of DOT will fall to the 1.272 Fibonacci extension level or $4.80.
Disclaimer. This analysis and forecast are the personal opinions of the author and are not a recommendation to buy or sell cryptocurrency and should not be viewed as an endorsement by CoinIdol. Readers should do their research before investing in funds.
Source: Read Full Article


