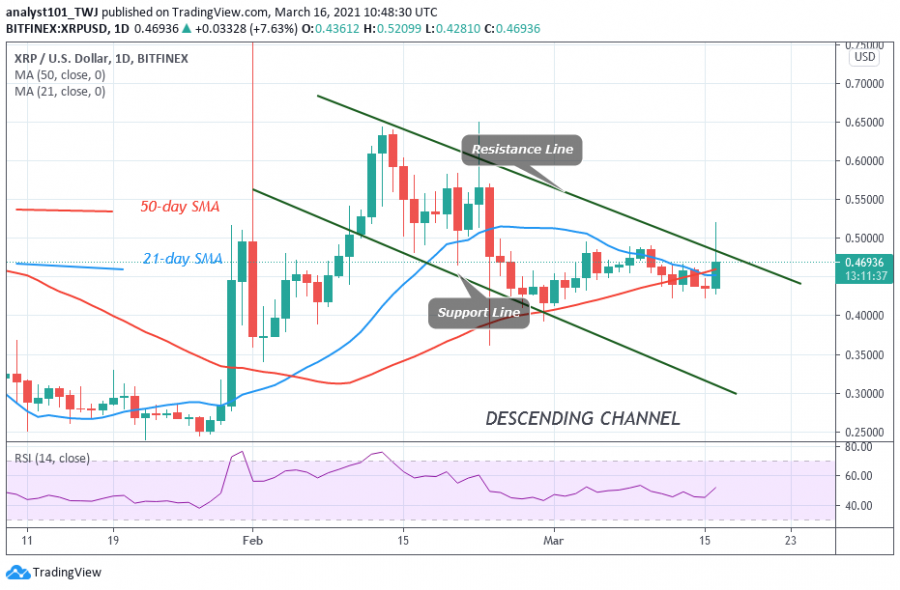
Today, there is a price spike as XRP rallied to $0.52 high after breaking the resistance line of the descending channel. Soon after reaching the recent high, the price plunged back to the channel.
The upward move is now facing rejection at the $0.48 price level. In today’s price action the candlestick is displaying a long wick. The long wick is indicating that XRP has strong selling pressure at a higher price level.
The upward move is doubtful except there are sufficient buyers at higher price levels. Nonetheless, the altcoin upward move has been restricted between $0.43 and $0.50 since the February 23 breakdown. On the upside, if the bulls break the $0.50 overhead resistance, buyers are likely to come in to push prices upward. In other words, the next target price of $0.65 is achievable. Conversely, if the bears have the upper hand and break the $0.43 support, the altcoin will further decline to $0.35 low.
Ripple indicator analysis
The price is attempting to break the resistance line of the descending channel. A break above it will signal the resumption of the uptrend. Also, the price is partially above the SMAs which indicate a possible rise in price. The Relative Strength Index period 14 is at level 51. This indicates that there is a balance between supply and demand.
Technical indicators:
Major Resistance Levels – $0.65 and $0.75
Major Support Levels – $0.35 and $0.30
What is the next move for Ripple?
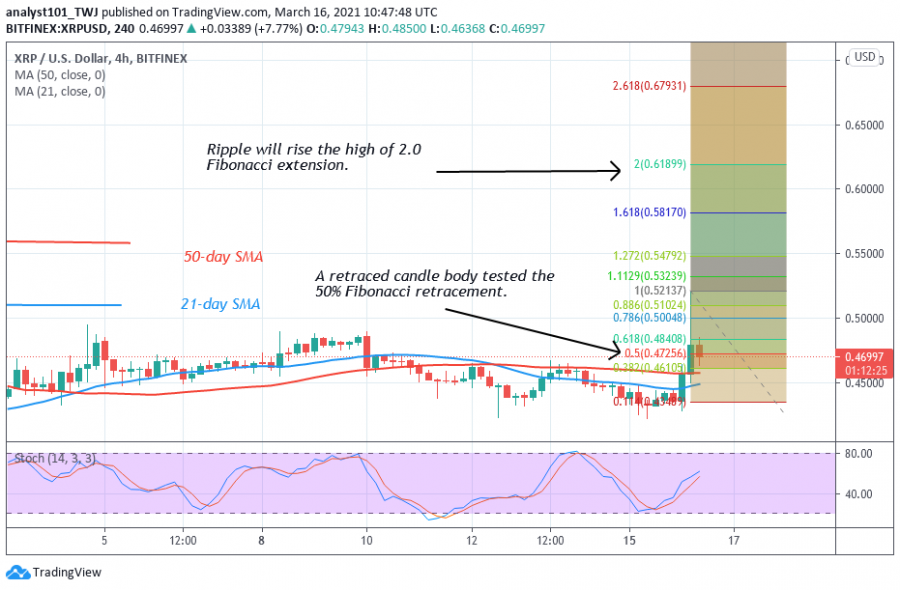
Ripple upward move is doubtful. It depends upon breaking the resistance at $0.50. Meanwhile, On March 16 uptrend; a retraced candle body tested the 50% Fibonacci retracement level. The retracement indicates that Ripple will rise to level 2.0 Fibonacci extension or the high of $0.618.
Disclaimer. This analysis and forecast are the personal opinions of the author are not a recommendation to buy or sell cryptocurrency and should not be viewed as an endorsement by CoinIdol. Readers should do their own research before investing
Source: Read Full Article


