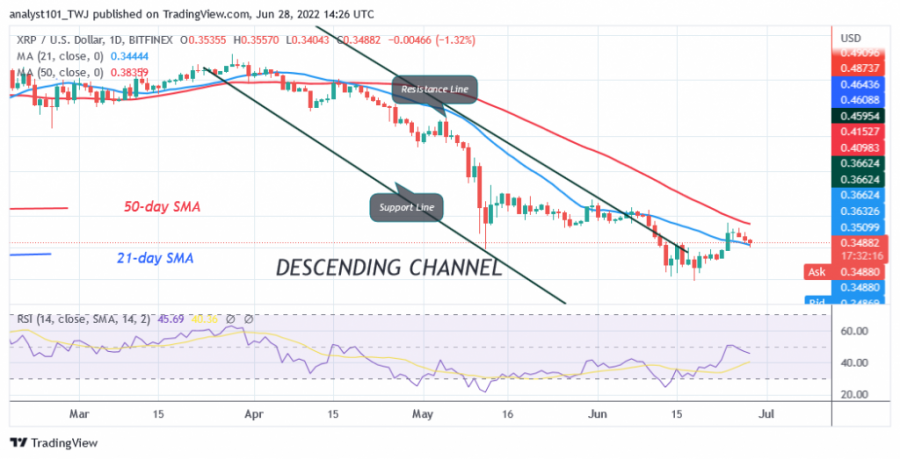
Ripple (XRP) has declined over the past three days after rejecting the high at $0.38. The decline has reached a low above the 21-day line SMA. The bears have this advantage to push the altcoin to the previous low at $0.30.
Subsequently, the downtrend will resume if the bears fall below the current support. In the previous price action, the bulls failed to maintain the upward momentum after crossing the 21-day line SMA. The uptrend was stopped at the high of $0.38. Had the bulls broken the 50-day line SMA, XRP would have risen to the high of $0.53. Today, XRP is trading above the 21-day line SMA, but below the 50-day line SMA. A break below the 21-day line SMA will put the altcoin under downward pressure again.
Ripple indicator analysis
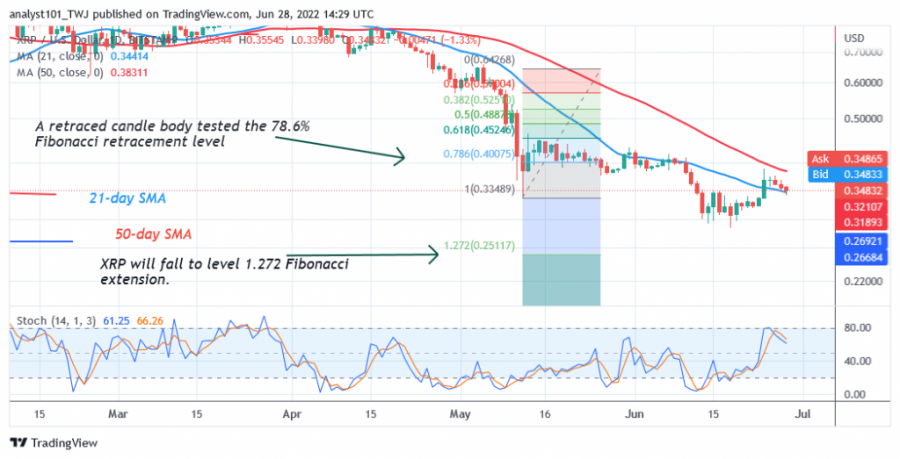
Ripple has fallen to level 46 on the Relative Strength Index for the 14 period. XRP is in the downtrend zone, while selling pressure is increasing again. The price of the altcoin is between the moving average lines, indicating a possible movement within the trading range. XRP is below the 80% area of the daily stochastic. The cryptocurrency is in a bearish momentum. It is likely that Ripple is retreating from the previous highs. The moving averages are still sloping south, indicating a downtrend.
Technical indicators:
Major Resistance Levels – $0.80 and $1.00
Major Support Levels – $0.40 and $0.20
What is the next move for Ripple?
Ripple is bearish due to the recent rejection at $0.38. The Fibonacci tool has indicated a possible decline. Meanwhile, on May 12, the downtrend has seen a retraced candlestick testing the 78.6% Fibonacci retracement level. The retracement indicates that XRP will fall to the 1.272 Fibonacci Extension level or $0.25.
Disclaimer. This analysis and forecast are the personal opinions of the author and are not a recommendation to buy or sell cryptocurrency and should not be viewed as an endorsement by CoinIdol. Readers should do their own research before investing
Source: Read Full Article


