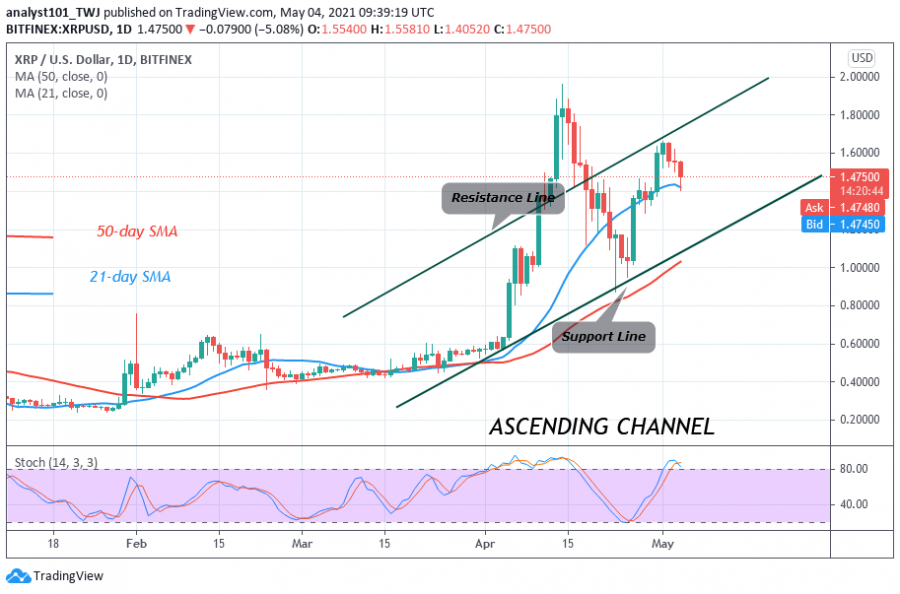
For the past week, Ripple has been in an upward move as the altcoin rallied to a $1.60 high. Buyers are facing penetration difficulty at the $1.60 resistance.
The bulls have been struggling to break above the recent resistance level. A retest at the $2.0 resistance zone is possible if the current resistance is breached. Otherwise, XRP will fall and resume downward correction. The altcoin has fallen to the support at $1.45. The downtrend will resume if the XRP price falls and breaks below level $1.45. In previous price action, the XRP fell below this level and was range-bound between levels $1.00 and $1.45. The XRP/USD has fallen to level $1.44 at the time of writing.
Ripple indicator analysis
On the daily chart, XRP has fallen to the 21-day SMA, if the support holds, the upward move will resume. Meanwhile, XRP is above the 80% range of the daily stochastic. The stochastic bands are sloping downward indicating a possible bearish momentum.
Technical indicators:
Major Resistance Levels – $1.95 and $2.0
Major Support Levels – $0.60 and $0.55
What is the next move for Ripple?
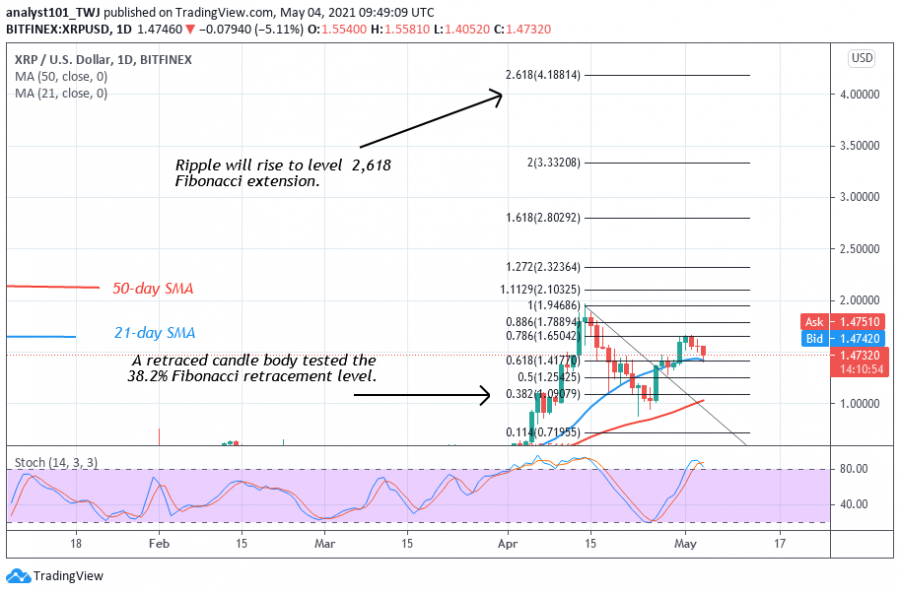
Ripple has a high prospect of an upward move. The price indicator has confirmed a further upward movement of prices. Meanwhile, on April 14 uptrend; a retraced candle body tested the 38.2% Fibonacci retracement level. The retracement indicates that Ripple is likely to rise to level 2.618 Fibonacci extension or the high of $4.18.
Disclaimer. This analysis and forecast are the author’s personal opinions and not a recommendation to buy or sell cryptocurrency and should not be viewed as an endorsement by CoinIdol. Readers should do their own research before investing
Source: Read Full Article


