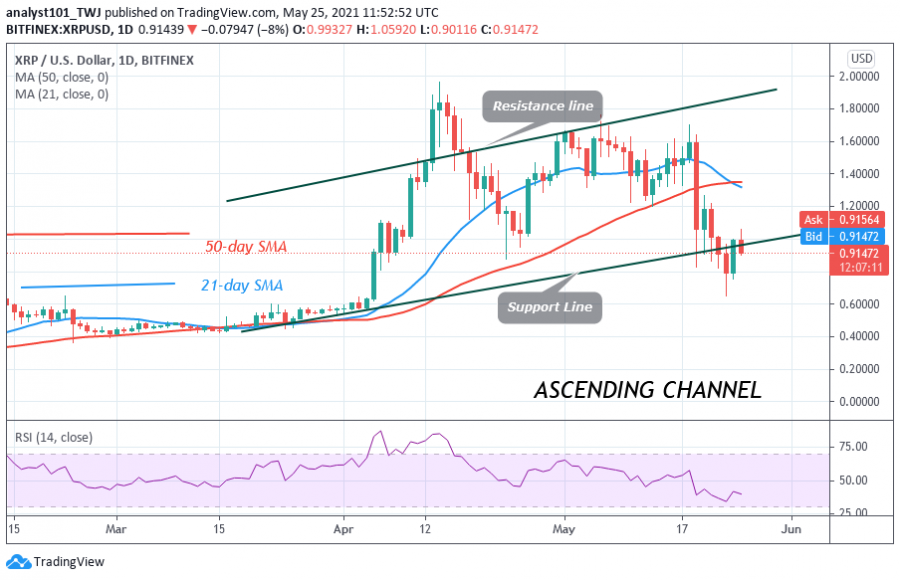
Since May 19, Ripple has been in a bearish trend as the altcoin was repelled after testing the $1.70 resistance. XRP price was making a series of lower highs and lower lows as the altcoin slumped to $0.65 low.
The price corrected upward to $1.05 but was repelled. As price faces rejection there is the possibility of further downward movement of price. In the previous price action, Ripple was in a sideways trend as bulls attempted to break the $1.70 resistance level. The bears successfully defended the previous high. However, the bulls were repelled after three unsuccessful attempts at the $1.70 high. XRP is retracing after the recent rejection. Further downward move to $0.65 is expected if the price breaks the $0.80 support.
Ripple indicator analysis
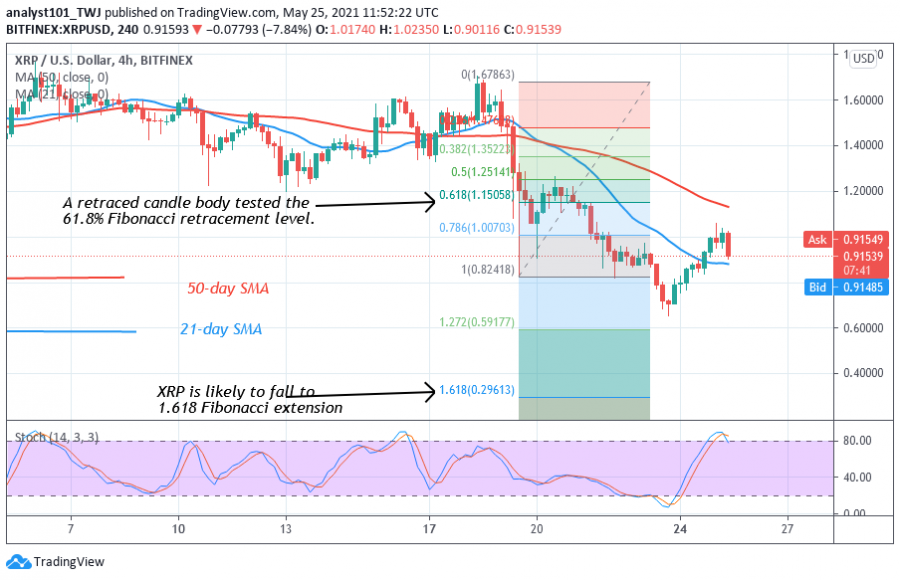
The altcoin has fallen to level 40 of the Relative Strength Index period 14. It indicates that the market is in the downtrend zone and below the centerline 50. XRP is above the 80% range of the daily stochastic. It indicates that the market has reached the overbought region as sellers emerge to push prices down. XRP is likely to fall.
Technical indicators:
Major Resistance Levels – $1.95 and $2.0
Major Support Levels – $0.60 and $0.55
What is the next move for Ripple?
XRP is in a downward move. Sellers have resumed another round of selling pressure. Meanwhile, on May 19 downtrend; a retraced candle body tested the 61.8% Fibonacci retracement level. The retracement indicates that Ripple is likely to fall to level 1.618 Fibonacci extension or the low of $0.29.
Disclaimer. This analysis and forecast are the personal opinions of the author are not a recommendation to buy or sell cryptocurrency and should not be viewed as an endorsement by CoinIdol. Readers should do their own research before investing.
Source: Read Full Article


