The Ripple (XRP) price rose after the price decline on May 8.
Long-term forecast for the Ripple price: bearish
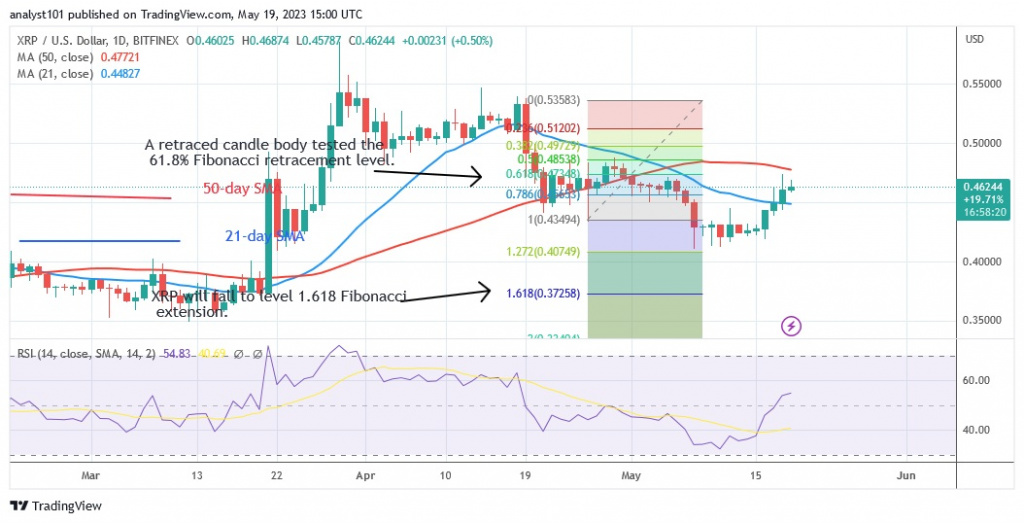
The cryptocurrency asset rose to a high of $0.47 before declining. Since the altcoin’s price rose above the 21-day line SMA, it has been between the moving average lines. Nevertheless, the current price of XRP is $0.46. Further upward movement for XRP, which is stuck between the moving averages, is unlikely to the upside. If the 21-day line SMA is broken, the uptrend will resume. The altcoin will return to its high of $0.55. However, if the moving average lines are not broken, the cryptocurrency will remain trapped. On the other hand, if the bears break below the 21-day line SMA, there is a high probability that the price will fall into the downtrend zone.
Ripple indicator analysis
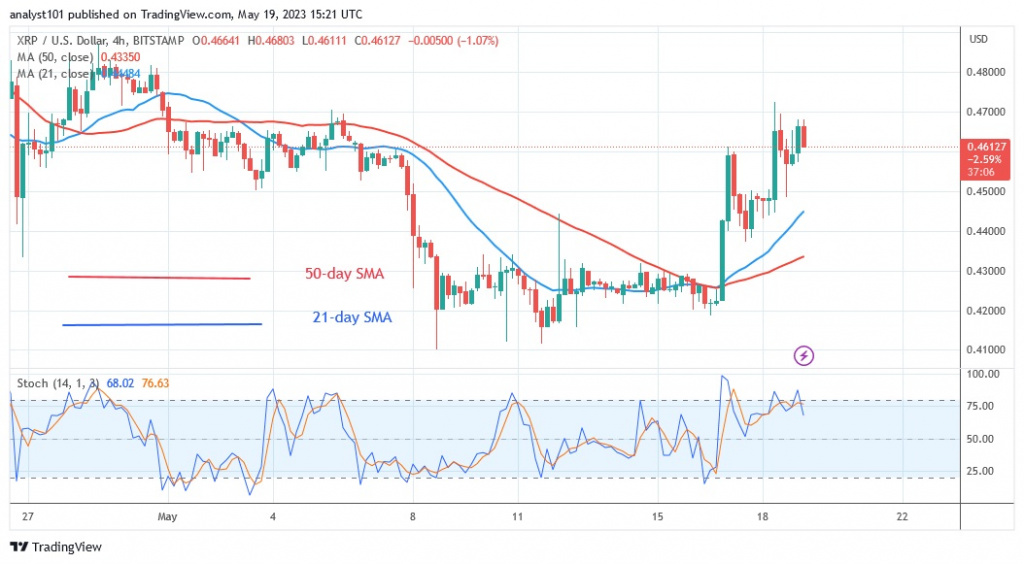
Ripple is at level 54 in the Relative Strength Index for the period 14. Entering the positive trend zone, the cryptocurrency has received another upward impulse. However, the price bars are inside the moving average lines, which will prevent the cryptocurrency from going higher. XRP will instead be forced to trade in a range between the moving average lines. Above the daily stochastic threshold of 75, Ripple is in a positive momentum.
Technical indicators:
Key resistance levels – $0.80 and $1.00
Key support levels – $0.40 and $0.20
What is the next move for Ripple?
The market for Ripple is overbought due to its growth. That is, the overbought area of the market will cause the current upward momentum to slow down. In addition, the price of XRP is fluctuating between the moving average lines. This indicates that XRP will have some fluctuation during this period.
Disclaimer. This analysis and forecast are the personal opinions of the author and are not a recommendation to buy or sell cryptocurrency and should not be viewed as an endorsement by CoinIdol. Readers should do their own research before investing
Source: Read Full Article


