The price of Uniswap (UNI) is in a downtrend as the price falls below the moving average lines.
Uniswap (UNI) price long-term analysis: bearish
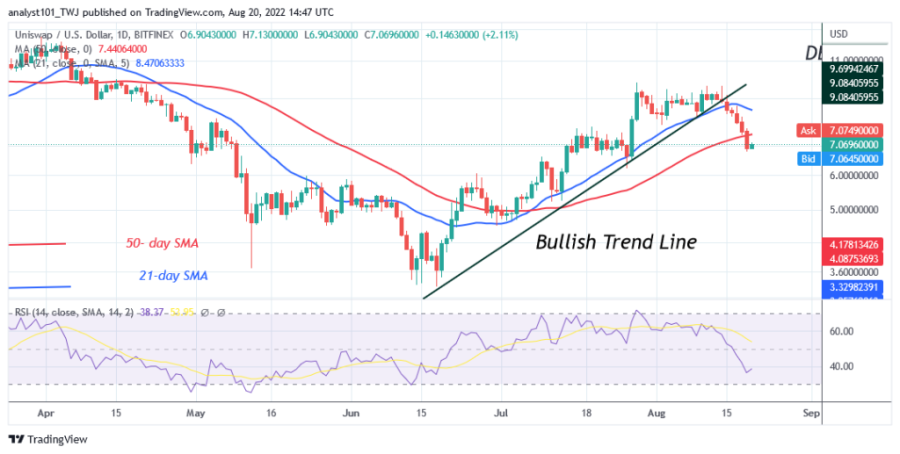
During the uptrend on July 28, the bulls failed to break the overriding resistance of $10. Before the recent downtrend, Uniswap coin was forced to move sideways. The current uptrend ended when the price broke below the moving average lines. UNI will continue to fall when the altcoin reaches the low of $6.80.
However, the current support is the historical price level seen on July 20. On the downside, UNI will continue to fall to the low of $5.23 or $6.09 if the bears fall below the current support. In the meantime, the altcoin is rising as it may face rejection at the high of $7.40.
Uniswap (UNI) Indicator Analysis
Uniswap is at level 36 of the Relative Strength Index for the period 14. UNI is in a downtrend as the altcoin approaches the oversold area of the market. The uptrend has ended as the price has fallen below the moving average lines and the uptrend line. Selling pressure could continue as long as the price bars below the moving average lines.
Technical Indicators
Key resistance zones: $12.00, $14.00, $16.00
Important support zones: $10.00, $8.00, $6.00
What is the next direction for Uniswap (UNI)?
Uniswap is in a downtrend as the price has fallen below the moving average lines. There is a tendency for further downward movement of the cryptocurrency.
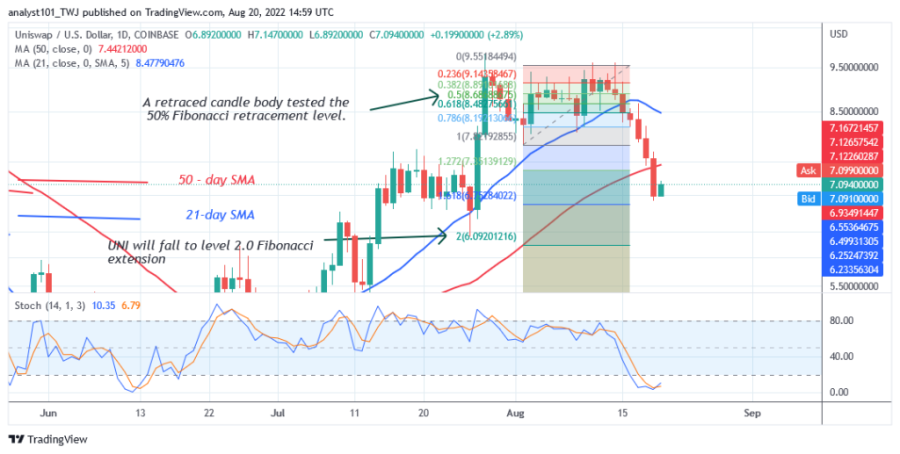
Meanwhile, the August 2, 2022 downtrend has shown a candle body testing the 50% Fibonacci retracement level. The retracement suggests that UNI will fall to the 2.0 Fibonacci extension level or the $6.09 level. The price action shows that UNI fell to the low of $6.80, but then recovered.
Disclaimer. This analysis and forecast are the personal opinions of the author and are not a recommendation to buy or sell cryptocurrency and should not be viewed as an endorsement by CoinIdol. Readers should do their research before investing funds.
Source: Read Full Article


