The health of a state’s economy depends on perspective. For businesses, the primary considerations may be taxes and the extent to which workforces can organize or demand benefits. For workers, the issues tend more toward wages and insurance. For economists, the measures could be unemployment and state gross domestic product (GDP). While it is hard to say which of these should be the deciding factors, there are some ways to blend them together.
To determine the state with the worst economy, both in the years leading up to the pandemic and during it, 24/7 Wall St. created an index of five measures: five-year economic growth, five-year employment growth, the poverty rate, unemployment rate and share of adults with a bachelor’s degree or higher.
To make a final decision, we found that the states with economies that rank on the lower end depend on industries that were hit hard by the COVID-19 pandemic. States like Hawaii and Nevada, where tourism is an economic pillar, as well as states like Wyoming and Alaska that depend on resource extraction, rank lower on this list than they perhaps otherwise would if not for the pandemic.
To determine the state with the worst economy, 24/7 Wall St. ranked states based on an index comprising the five measures mentioned above. The average annual GDP growth rate from the fourth quarter of 2015 to the fourth quarter of 2020 came from the Bureau of Economic Analysis and was included in the index at full weight. The average annual employment growth rate from March 2016 to March 2021 came from the Bureau of Labor Statistics (BLS) and was included in the index at full weight. The seasonally adjusted unemployment rate as of March 2021 also came from the BLS and was included in the index at full weight. The share of the population living below the poverty line and the share of adults with a bachelor’s degree or higher came from the U.S. Census Bureau’s 2019 American Community Survey (ACS) and were included in the index at full weight.
In addition to the components in the index, we considered additional state data. Real GDP and contributions to real GDP growth by industry came from the Bureau of Economic Analysis (BEA). Median household income, bachelor’s degree attainment rate and the share of workers commuting outside of the state for work came from the 2019 ACS. The affordability ratio of median home value to median household income is a 24/7 Wall St. calculation based on ACS data. Data on regional price parity, a measure of cost of living, came from the BEA and is for 2019. Population change due to natural causes and net migration from 2010 to 2020 came from the U.S. Census Bureau. All data are for the most recent period available.
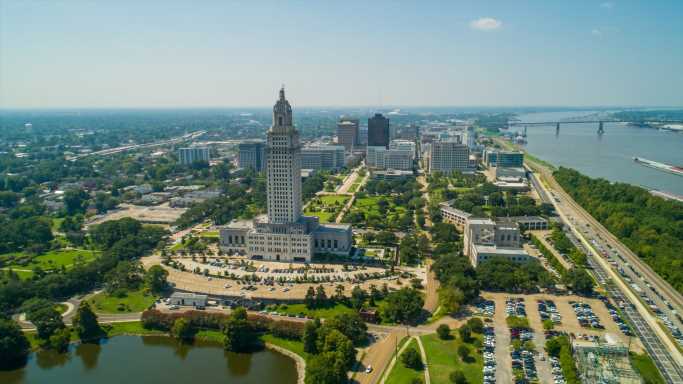
The state with the worst economy is Louisiana. Here are the details:
> 5-yr. annualized GDP growth through Q4 2020: +0.3% (12th lowest)
> 5-yr. annualized employment growth through March 2021: -0.8% (8th lowest)
> March 2021 unemployment rate: 7.3% (8th highest)
> Poverty rate: 19.0% (2nd highest)
Louisiana’s economy ranks as the worst in the United States. The state shed nearly 114,000 jobs during the pandemic, and partially as a result, employment is down 4.1% from where it was five years ago. Currently, 7.3% of the labor force in Louisiana are out of work, one of the higher jobless rates among states and well above the 6.0% national unemployment rate.
An estimated 19.0% of the state’s population live below the poverty line, the second largest share of any state and well above the 12.3% national poverty rate. The widespread financial hardship in Louisiana is indicative of deeply seated economic problems.
Click here to read The State With The Best Economy
Source: Read Full Article
