Stellar lumen price is trading in a bullish zone above $0.2600 against the US Dollar, similar to bitcoin. XLM price could start a fresh increase if it clears the $0.3200 resistance.
Stellar Lumen Price Analysis (XLM to USD)
After a strong surge towards $0.4000 and $0.4100, stellar lumen price started a downside correction against the US Dollar. The XLM/USD pair broke the $0.3800 support zone to move into a short-term bearish zone.
There was also a break below the $0.3500 support level. The price moved below the $0.3000 support, but the bulls were active near $0.2200. A low was formed near $0.2113 before the price climbed higher. It broke the $0.2500 and $0.2600 resistance levels.
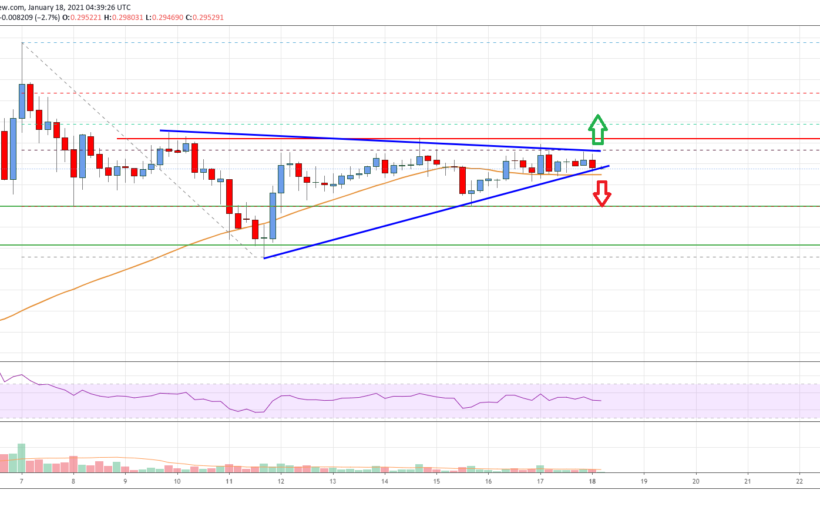
There was also a break above the 23.6% Fibonacci retracement level of the downward move from the $0.4153 high to $0.2133 low. It seems like there is a crucial contracting triangle forming with resistance near $0.3130 on the 4-hours chart.
The triangle resistance is close to the 50% Fibonacci retracement level of the downward move from the $0.4153 high to $0.2133 low. A close above the triangle resistance and $0.3200 could open the doors for a strong surge.
The next major resistance is near the $0.3500 level, above which XLM price could revisit the $0.4000 resistance zone in the coming sessions. On the downside, the triangle support is close to the 55 simple moving average (4-hours).
If there is a break below the $0.2800 support level and the 55 simple moving average (4-hours), there is a risk of more losses. The next major support is near the $0.2600 level. Any more losses might lead the price towards the $0.2200 support zone.

Stellar Lumen (XLM) Price
The chart indicates that XLM price is clearly consolidating well above $0.2600 and the 55 simple moving average (4-hours). Overall, the price could either correct further to $0.2200 or it might start a fresh rally above $0.3200.
Technical Indicators
4 hours MACD – The MACD for XLM/USD is losing momentum in the bearish zone.
4 hours RSI – The RSI for XLM/USD is currently declining towards the 40 level.
Key Support Levels – $0.2800 and $0.2600.
Key Resistance Levels – $0.3120, $0.3200 and $0.3500.
Source: Read Full Article