
Popular cryptocurrency trading platform TradingView has added a new feature known as the Bitcoin Timeline. The feature shows Bitcoin’s price changes with events that very likely led to the price change. The unveiled chart currently shows events of the last 10 years that may have affected the price of Bitcoin on its way up. Speaking on the idea.
The price of Bitcoin has historically been affected by events such as sudden announcements or regulations. Even traders are aware of this relationship and often make trading decisions based on such developments and how investors react. TradingView harnessed this correlation with events to produce the new tool.
Such correlation was shown yesterday when Bitcoin’s price dropped allegedly due to comments by U.S Treasury nominee Janet Yellen saying Bitcoin is used “mainly for illicit financing”. Similar effects have been seen in altcoins like when Elon Musk tweets about Dogecoin and its price goes up.
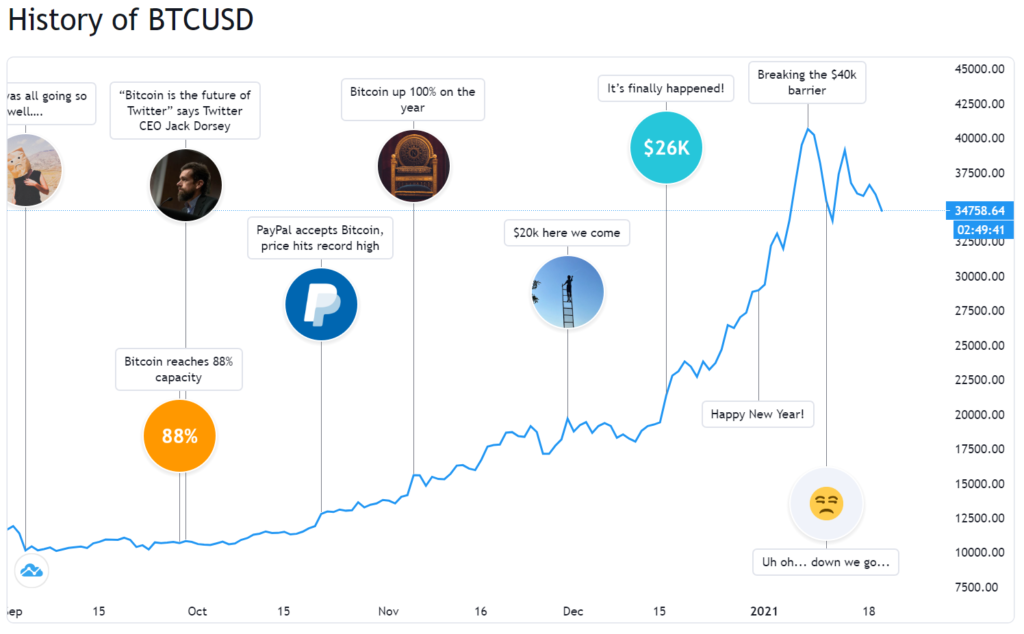
Some significant events that have featured on the Bitcoin timeline are from 2020. They include PayPal’s adoption of Bitcoin which made the price reach new highs and Twitter CEO Jack Dorsey saying Bitcoin is the future of Twitter.
TradingView says it will update the chart with new events every 14 days. The update may however be done earlier if any sudden development comes up that influences price significantly.
Source: Read Full Article