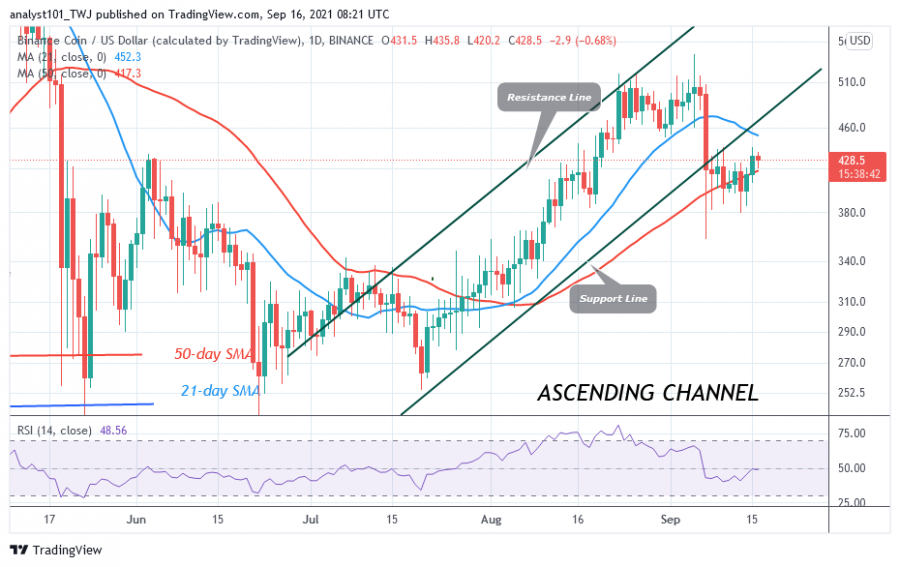
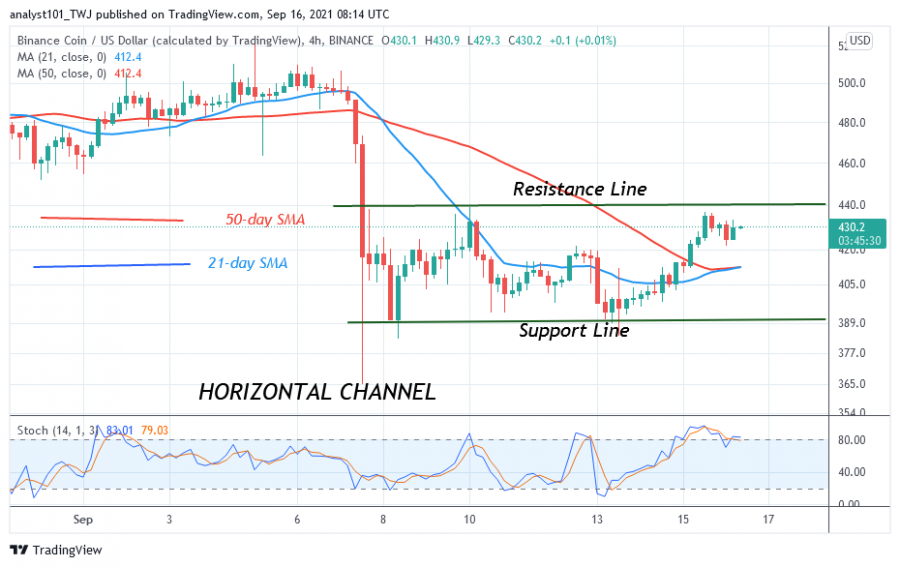
Binance Coin (BNB) price broke out above the 50-day line SMA as it resumed its uptrend. Today, the altcoin faces resistance at $440. Once buyers break through the $440 resistance, BNB/USD will rise to $510.
However, as the cryptocurrency asset faces rejection at the recent high, the altcoin will likely resume a downward correction. Meanwhile, Binance Coin is trading between the 21-day line SMA and the 50-day line SMA. The uptrend will continue if the price breaks above the 21-day line SMA. Binance Coin is in the bullish trend zone if the bulls break above the moving averages.
Binance Coin indicator reading
BNB is at level 48 of the Relative Strength Index of period 14, indicating that the market is in the downtrend zone and below the centre line 50. The cryptocurrency is above the 80% range of the daily stochastic. The market is in a bullish momentum and has reached the overbought region of the market. Sellers will emerge in the overbought region.
Technical indicators:
Major Resistance Levels – $700 and $750
Major Support Levels – $400 and $350
What is the next direction for BNB/USD?
It is likely that Binance Coin will continue the downward correction as the price fluctuates between the $389 and $440 levels. The altcoin has suffered two setbacks at the $440 resistance. The market is currently falling back to the lower price range at the $389 level. The price action will continue if the cryptocurrency finds support above the $389 level.
Disclaimer. This analysis and forecast are the personal opinions of the author and are not a recommendation to buy or sell cryptocurrency and should not be viewed as an endorsement by CoinIdol. Readers should do their own research before investing funds.
Source: Read Full Article


