
Total crypto market cap added $12 billion to its value for the period since Monday and now stands at $2.26 trillion. The top ten coins showed mixed results for the last 24 hours with Terra (LUNA) losing 9.9 percent while XRP (XRP) added 1.4 percent to its valuation. At the time of writing bitcoin (BTC) is trading at $48,360. Ether (ETH) is at $3,936.
BTC/USD
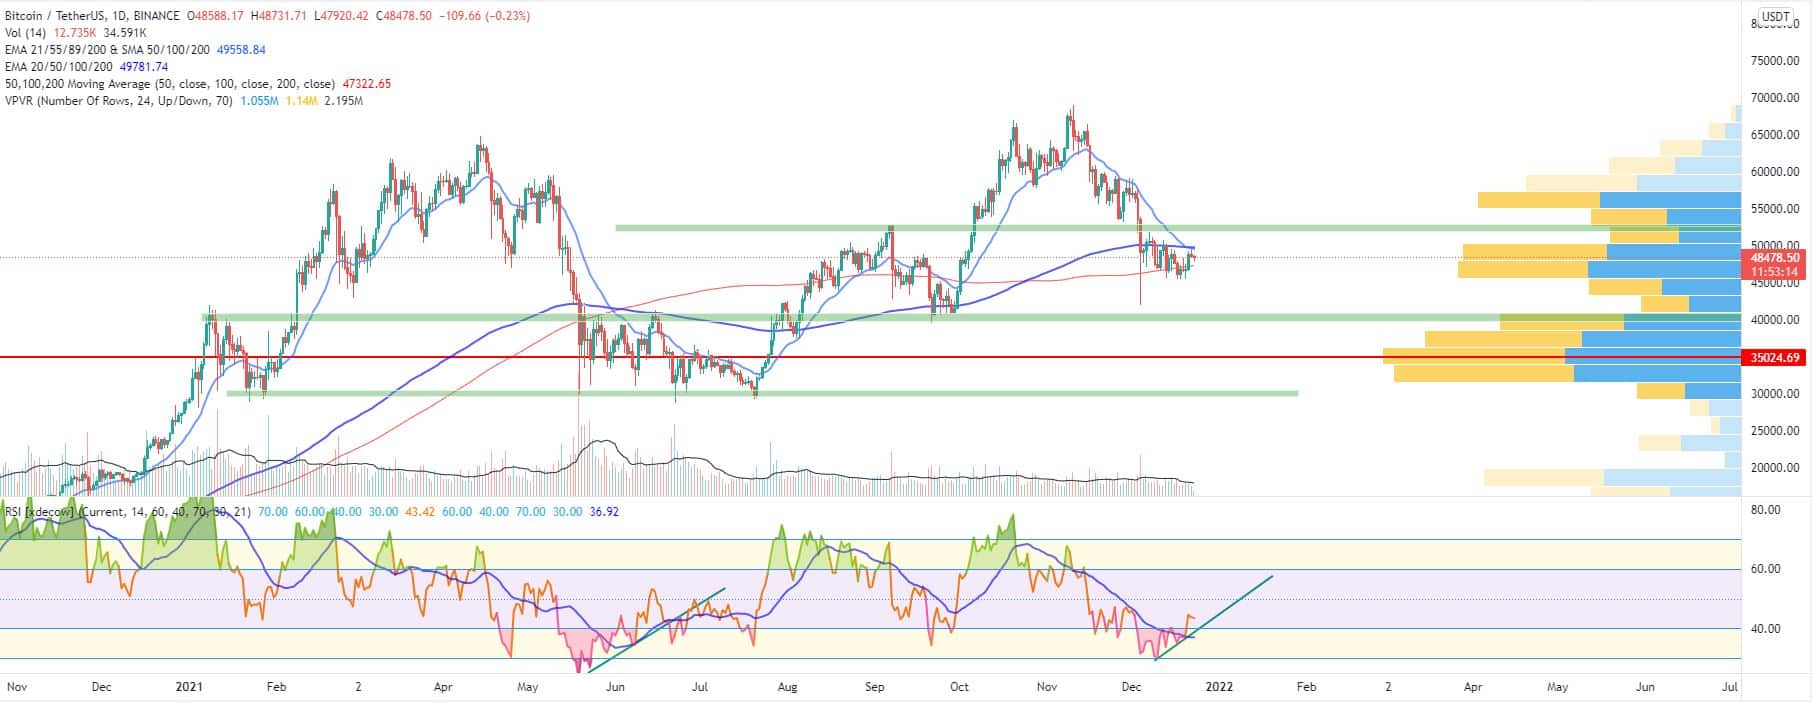
Bitcoin closed the trading day on Sunday, December 19 flat, at $46,700, and below the 200-day simple moving average. Bulls were attempting a breakout hoping that BTC has reached its local bottom and the selling pressure had decreased.
Not only that, but on the daily timeframe, we could see the formation of bullish divergence between the price action and the Relative Strength Indicator (RSI) values. However, this pattern should not be taken as buying signal since it has proofed it can mean many things for the mid-term direction of BTC, and is hard to time its impact on the price direction. Notably, we saw the exact same behavior back in early June yet the coin lost 15 more percent in the subsequent weeks.
It was 7 percent down for the last seven-day period.
On Monday, the BTC/USDT pair dropped down to $45,500 in the early hours of trading but then managed to regain positions above $46,500. It is worth noting that the trading volumes started picking up pace again.
The Tuesday session was the best one in weeks for bulls. Bitcoin climbed up to $49,100 and added 4.5 percent to its valuation, also breaking above the short-term diagonal downtrend line.
The mid-week session on Wednesday saw BTC hitting the meeting point of the 21 and 200-day EMAs at $49,700 before dropping back down to $48,400.
What we are seeing midday on Thursday is a second consecutive red candle for BTC as it is trading slightly lower.
ETH/USD
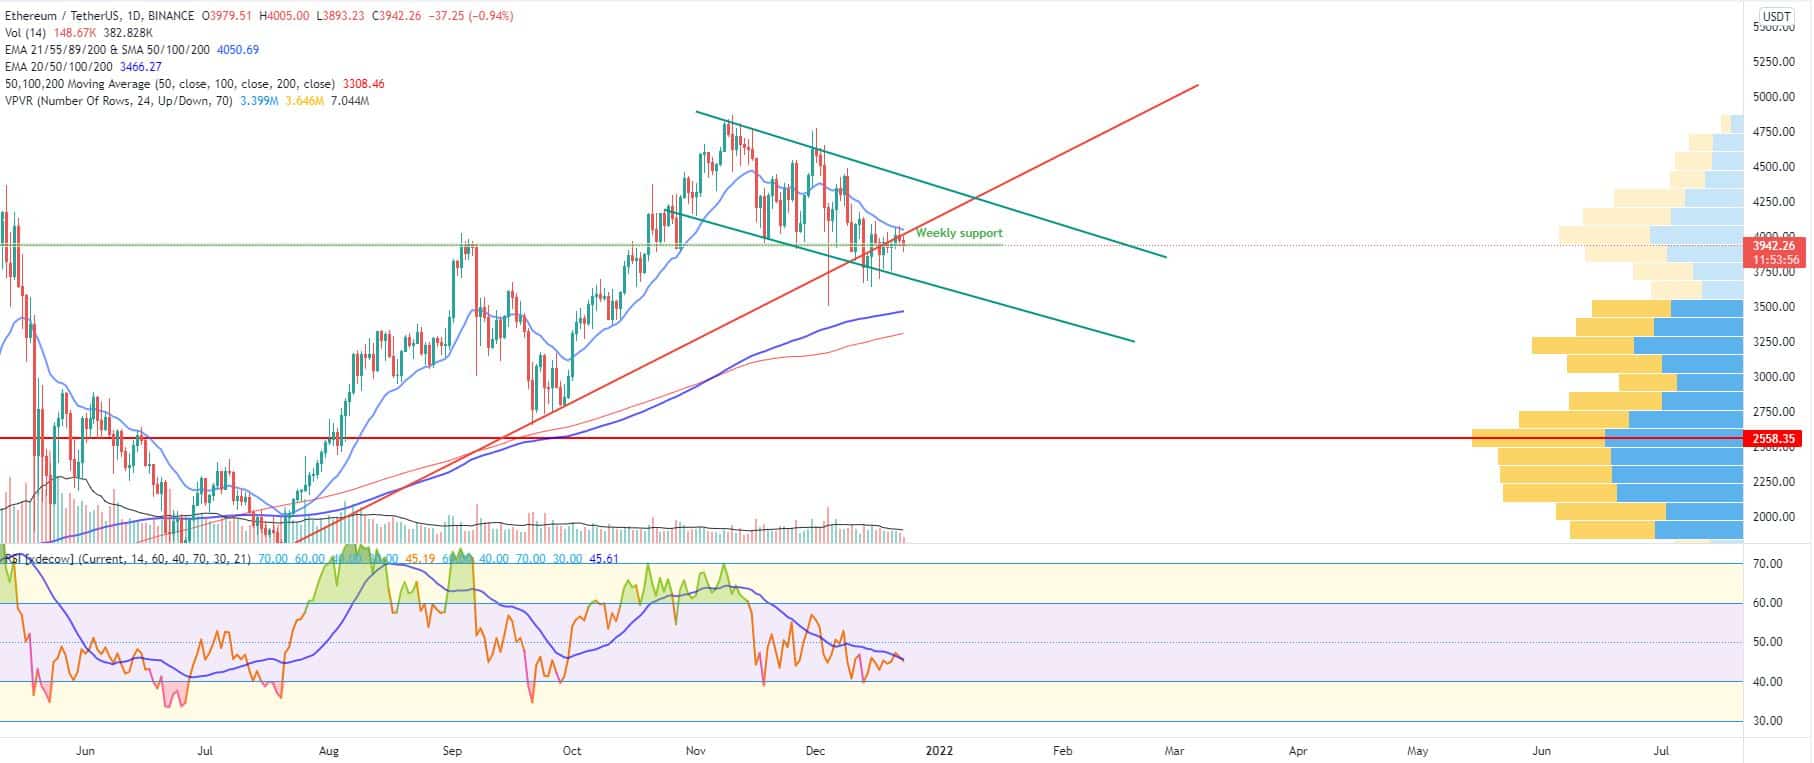
The ether remained extremely volatile in the last week of trading. It lost 4.7 percent of its market capitalization, but also moved below the horizontal and diagonal supports – both of them situated below the $4,000 price mark. The ETH token ended the trading day on Sunday at $3,920.
On Monday, December 20, it fell 5.5 percent down in the morning, but the sell orders were quickly absorbed, so buyers were able to push the price up to $3,945 and to close with a short green candle. The RSI indicator was stable below 50 since the beginning of the month.
The ETH/USDT pair initiated a strong move to the upside on Tuesday, hitting the 21-day EMA around $4,064 during intraday before closing at $4,030. The coin was building an ascending triangle pattern on the last leg and a solid bull flag on the daily chart.
The third day of the workweek came with an attempt from bull to break above the 21-day EMA dynamic resistance. It reached a daily high of $4,072 before making a full retrace at the daily candle close.
The leading altcoin is trading sub-$4,000 as of the time of writing.
Related posts:
Source: Read Full Article