Bitcoin price is rising above $22,500 against the US Dollar. BTC might extend gains if there is a clear move above the $23,500 resistance zone.
Bitcoin Price Analysis
Bitcoin price started a fresh increase from the $21,500 support zone. A base was formed and the price climbed higher above the $22,500 resistance zone.
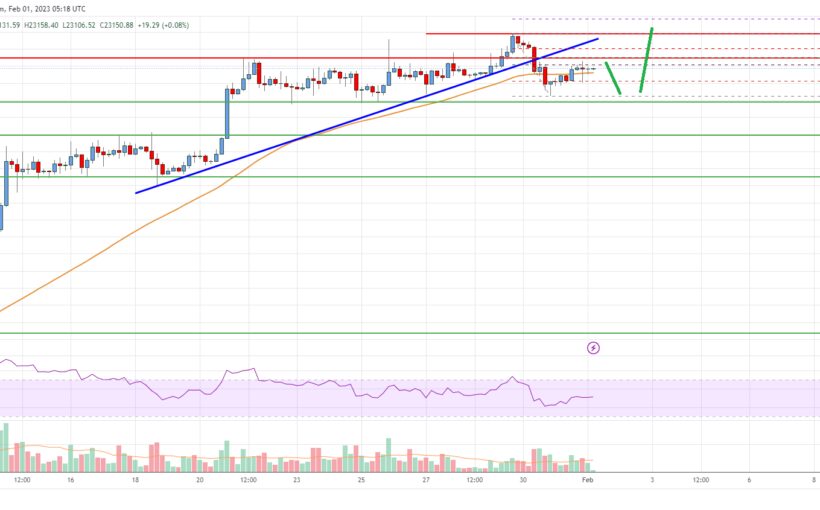
The bulls pushed the price above the $23,000 resistance and the 55 simple moving average (4-hours). The upward move was such that the price climbed towards the $23,500 resistance zone. A high is formed near $23,966 and the price is now correcting gains.
There was a move below the $23,500 support zone. There was a break below a major bullish trend line with support near $23,240 on the 4-hours chart of the BTC/USD pair.
The price traded as low as $22,500 and is currently rising. There was a move above the 23.6% Fib retracement level of the recent decline from the $23,966 swing high to $22,500 low. It is now trading above $22,500 and the 55 simple moving average (4-hours).
An immediate resistance on the upside is near the $23,250 level. It is near the 50% Fib retracement level of the recent decline from the $23,966 swing high to $22,500 low.
The next major resistance might near the $23,500 zone. The first major resistance is near the $24,000 level. A clear move above the $24,000 level might send the price towards $24,500, above which the price might rise towards the $25,000 level.
Any more gains might push the price towards the $26,200 zone. If there is no upside break, the price might decline below the $23,000 level. The first major support is near $22,500.
The next key support is near the $21,500 level, below which the price might accelerate lower. In the stated case, the price could decline towards the $20,600 level. Any more losses might send the price towards the $20,000 level.

Bitcoin Price
Looking at the chart, bitcoin price is clearly trading above $22,500 and the 55 simple moving average (4-hours). Overall, the price could continue to move up if it stays above the $22,200 resistance zone.
Technical Indicators
4 hours MACD – The MACD is now gaining momentum in the bullish zone.
4 hours RSI (Relative Strength Index) – The RSI is now above the 50 level.
Key Support Levels – $22,400 and $21,500.
Key Resistance Levels – $23,250, $23,500 and $24,000.
Source: Read Full Article