
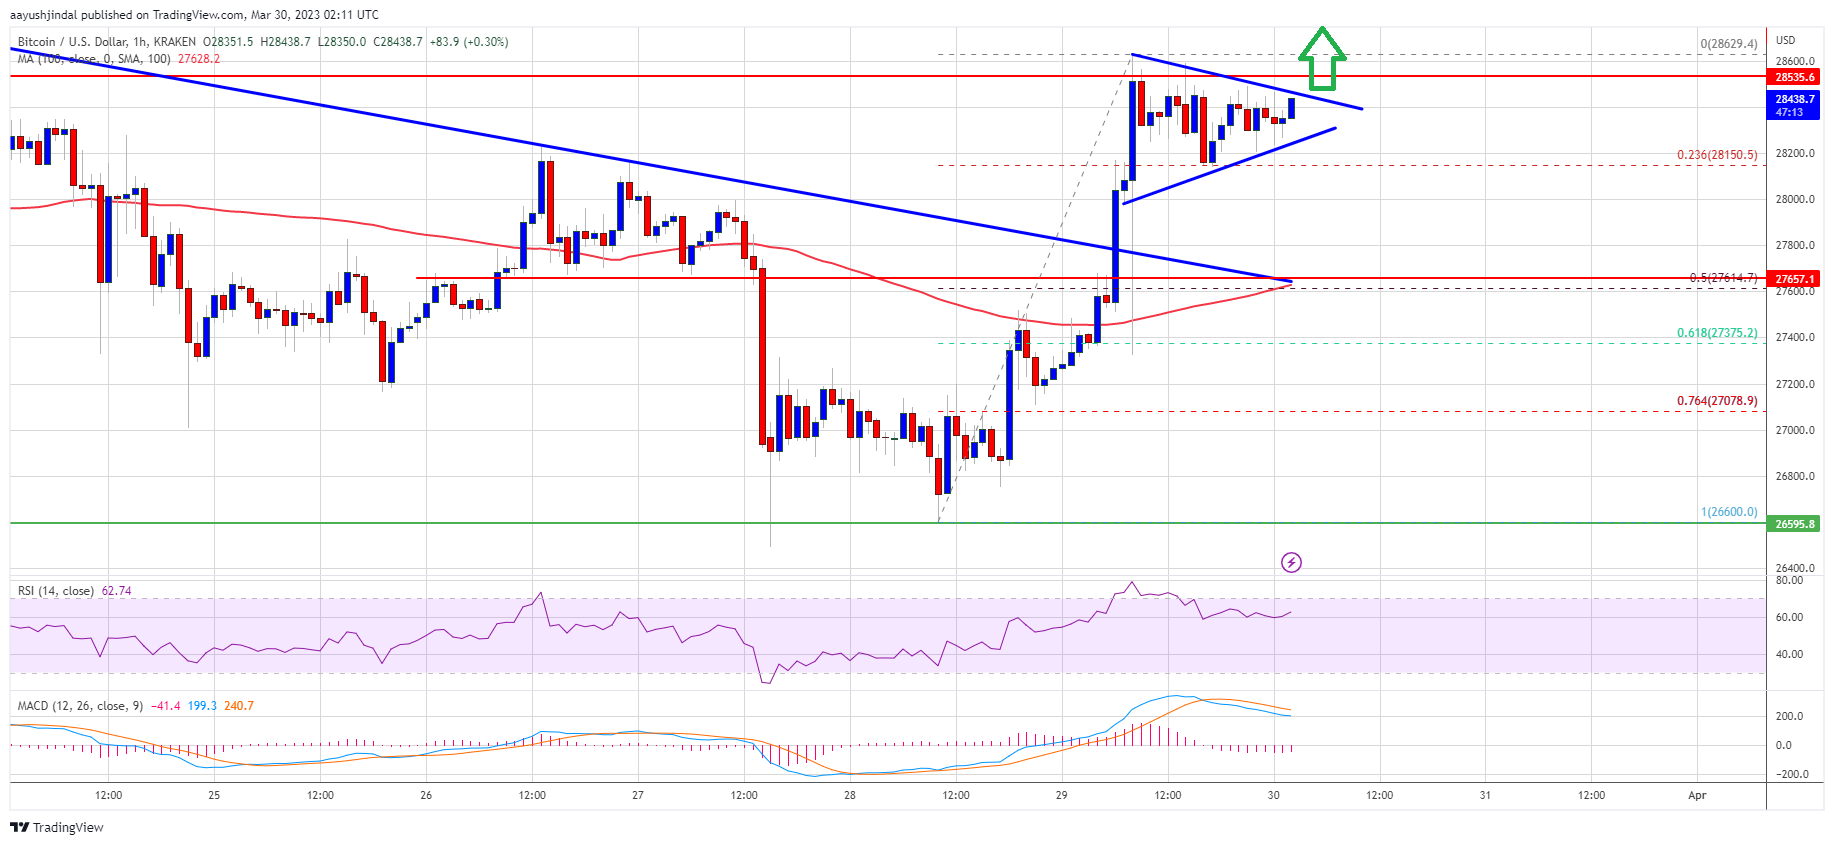
Bitcoin price is rising above the $28,000 resistance. BTC bulls seem to be aiming a fresh surge above the $28,500 and $28,800 resistance levels.
- Bitcoin is slowly moving higher above the $27,500 resistance zone.
- The price is trading above $28,000 and the 100 hourly simple moving average.
- There is a short-term breakout pattern forming with resistance near $28,500 on the hourly chart of the BTC/USD pair (data feed from Kraken).
- The pair could rally if there is a clear move above the $28,500 and $28,800 resistance levels.
Bitcoin Price Reclaims $28K
Bitcoin price started a decent increase above the $27,500 resistance. BTC gained pace and was able to clear many hurdles near the $27,800 and $28,000 levels.
During the increase, there was a break above a key bearish trend line with resistance near $27,800 on the hourly chart of the BTC/USD pair. It opened the doors for a push towards the key $28,500 resistance zone. A high is formed near $28,629 and the price is now consolidating gains.
Bitcoin price is now trading above $28,000 and the 100 hourly simple moving average. There is also a short-term breakout pattern forming with resistance near $28,500 on the hourly chart of the BTC/USD pair.
Source: BTCUSD on TradingView.com
On the upside, an immediate resistance is near the $28,500 level. The next major resistance is near the $28,800 zone. A close above the triangle resistance and then $28,800 might send the price further higher. In the stated case, the price could climb higher towards the $29,500 resistance. Any more gains might call for a test of the $30,000 resistance zone.
Another Rejection in BTC?
If bitcoin price fails to clear the $28,500 resistance, it could start another decline. An immediate support on the downside is near the $28,200 zone or the 23.6% Fib retracement level of the upward move from the $26,600 swing low to $28,629 high.
The next major support is near the $27,650 zone and the 100 hourly simple moving average. A downside break below the $27,650 support might spark a fresh decline. The next major support is near the $27,200 level, below which the price might test $26,500.
Technical indicators:
Hourly MACD – The MACD is now gaining pace in the bullish zone.
Hourly RSI (Relative Strength Index) – The RSI for BTC/USD is now above the 50 level.
Major Support Levels – $27,650, followed by $27,200.
Major Resistance Levels – $28,500, $28,800 and $30,000.
Source: Read Full Article