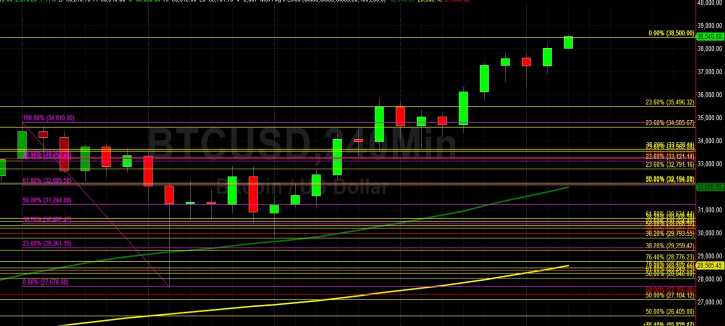
Bitcoin (BTC/USD) established another all-time high early in today’s North American session as the pair appreciated to the 38500.00 area after trading as low as the 36352.98 area during the European session, with the intraday high representing a test of an upside price objective around the 38523.54 level. Stops were elected above the 35943.73, 36480.83, and 36854.45 levels during the ascent, upside price objectives related to previous buying pressure around the 17580, 16200, and 9819.83 levels. A recent relative all-time high represented a test of the 35943.73 level, an upside price objective related to buying pressure that also recently emerged around the 17580 area. Stops were recently elected above some upside price objectives today including 34446.27, 34603.65, and 34697.35, levels that are technically significant due to previous buying activity that also originated around the 17580, 21913.84, and 16200 area. Additional upside price objectives include the 39033.37, 39247.05, 39656.27, 40411.19, 41200, 41267.10, 41489.74, 42701.91 levels.
Stops were elected below many retracement areas during the recent pullback lower, including the 32667.16, 31766.51, 31357.69, 30743.72, 30418.04, 30218.69, 29395.73, and 28258.75 levels. Following the pair’s recent moves to successive all-time highs, downside retracement levels and areas of potential technical support include the 35496.32, 34585.67, 33638.11, 33121.14, 32791.16, and 32164.09 levels. BTC/USD traded up more than 44% in January, and closed 2020 with a gain of approximately 292%. Traders are observing that the 50-bar MA (4-hourly) is bullishly indicating above the 100-bar MA (4-hourly) and above the 200-bar MA (4-hourly). Also, the 50-bar MA (hourly) is bullishly indicating above the 100-bar MA (hourly) and above the 200-bar MA (hourly).
Price activity is nearest the 50-bar MA (4-hourly) at 32009.69 and the 50-bar MA (Hourly) at 35225.62.
Technical Support is expected around 33638.11/ 33121.14/ 32164.09 with Stops expected below.
Technical Resistance is expected around 39033.37/ 39247.05/ 40411.19 with Stops expected above.
On 4-Hourly chart, SlowK is Bullishly above SlowD while MACD is Bullishly above MACDAverage.
On 60-minute chart, SlowK is Bullishly above SlowD while MACD is Bullishly above MACDAverage.
Related TAGS:
You can share this post!
Source: Read Full Article