Binance coin price corrected sharply lower towards the $200 support against the USDT. BNB is consolidating and it is likely to rally again above $250 and $280.
- Binance coin price started a strong decline from a new all-time high at $348 against the USDT.
- The price declined over $100, but it remained stable above the 100 simple moving average (4-hours).
- There is a major contracting triangle pattern forming with resistance near $250 on the 4-hours chart of the BNB/USDT pair (data source from Binance).
- The pair could start another rally if there is a clear break above $250 and $280.
Binance Coin Price Holding Key Support
There was an upside extension in binance coin above the $250 and $300 levels. BNB price even broke the $320 level and traded to a new all-time high at $348.
Recently, there was a sharp decline in bitcoin, ethereum, and altcoins. BNB also corrected lower sharply and broke a couple of important support at $300. It even broke the $250 support level and spiked below the $200 zone.
A low was formed near $187 before there was a strong recovery. The price climbed above $250, but it failed to gain strength for a push above $300. A high is formed near $280 and the price is currently consolidating. It traded below the 50% Fib retracement level of the recent wave from the $187 swing low to $280 high.
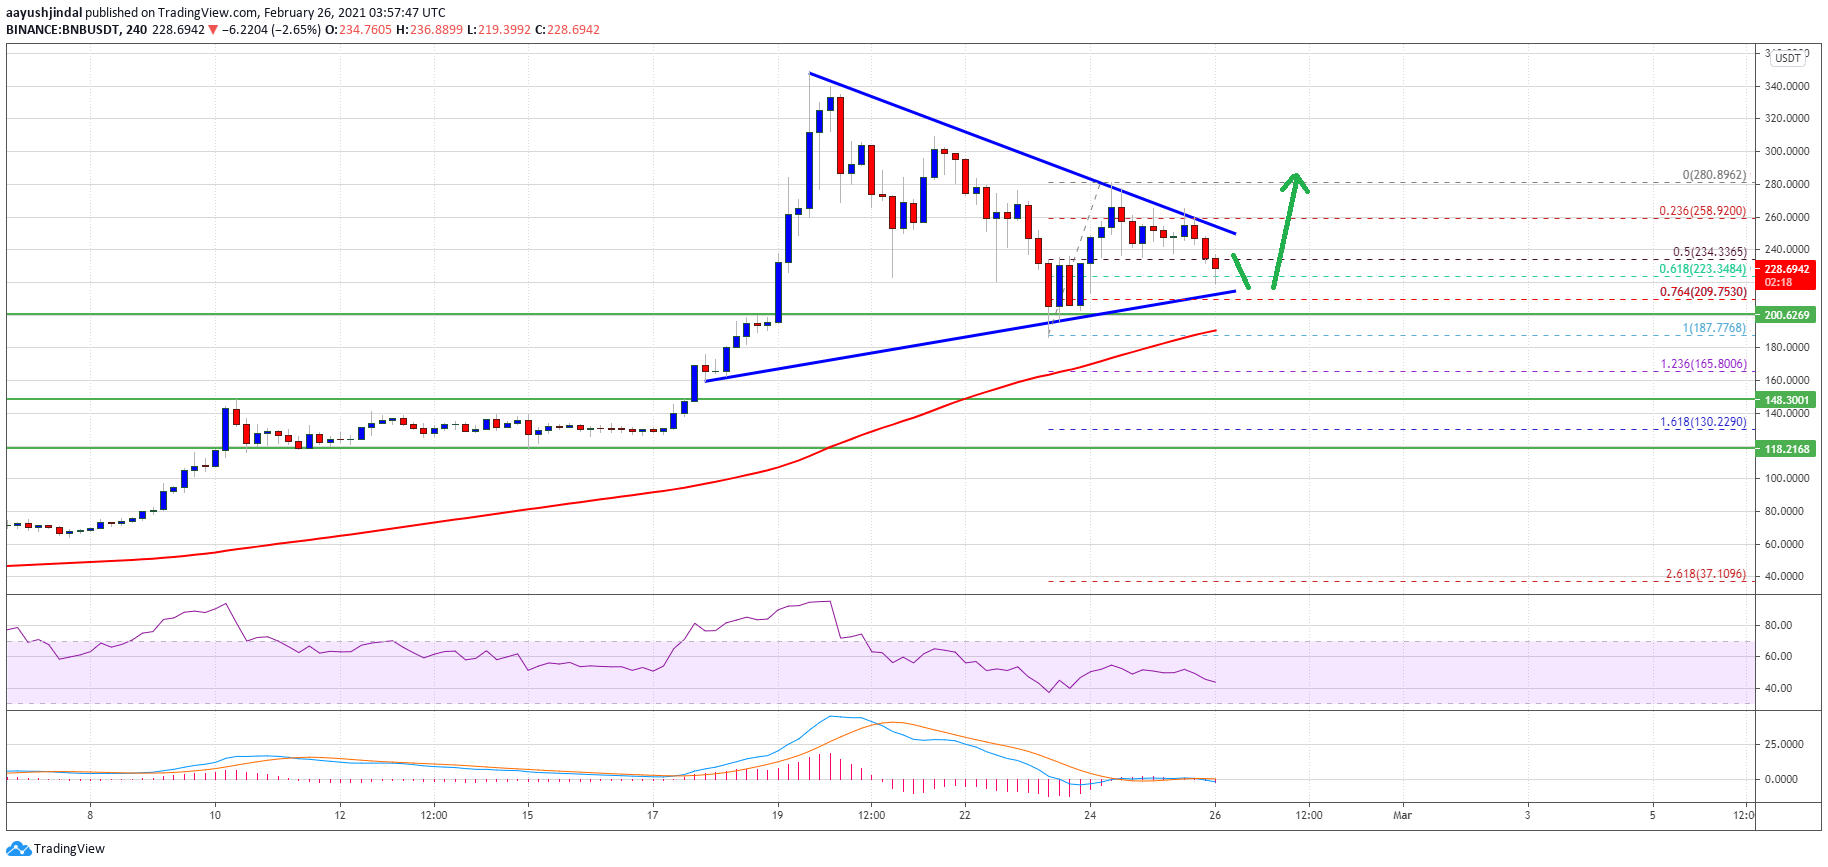
Source: BNBUSDT on TradingView.com
An initial support is near the $225 level. It is close to the 61.8% Fib retracement level of the recent wave from the $187 swing low to $280 high. It seems like there is a major contracting triangle pattern forming with resistance near $255 on the 4-hours chart of the BNB/USDT pair.
A clear upside break above the triangle resistance and $260 could open the doors for a fresh increase. The next key resistance is near the $280 level. The main barrier is at $300, above which the price could surge towards $350.
Dips Supported in BNB?
If BNB fails to continue higher above $255 and $260, there could be a fresh downside correction. The first major support is near the $225 level.
The next major support is near the $210 level or the triangle trend line. A downside break below the triangle support and $200 might call for a sharp decline towards the $150 support.
Technical Indicators
4-Hours MACD – The MACD for BNB/USDT is slowly moving in the bullish zone.
4-Hours RSI (Relative Strength Index) – The RSI for BNB/USDT is currently close to the 50 level.
Major Support Levels – $225, $210 and $200.
Major Resistance Levels – $250, $260 and $280.
Source: Read Full Article