
Over the past 48 hours, there has been a significant increase in the price of Dogecoin. This surge in value is attributed to market participants reacting positively to Twitter’s recent change of its home button to the doge meme. In the last 24 hours alone, the meme-coin experienced a boost of nearly 27%. It broke through the $0.10 price level.
The technical analysis of the coin also suggests an extremely bullish trend on the chart, with buyers rushing to the market and a surge in demand for the meme-coin. Accumulation has also seen a substantial positive shift.
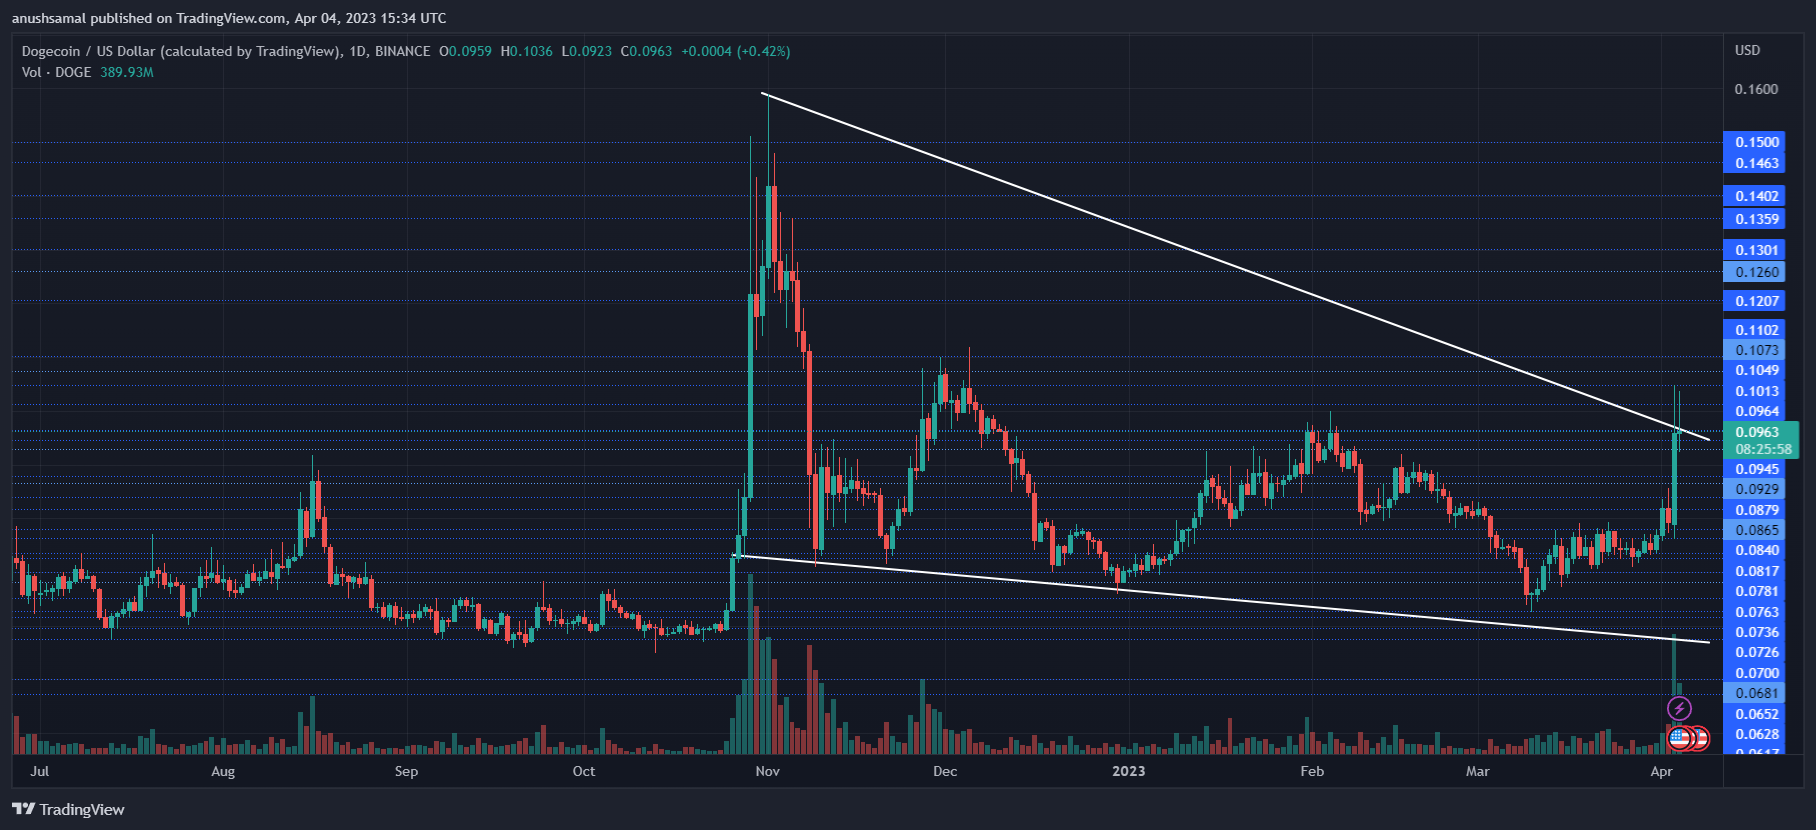
Furthermore, Dogecoin has formed a pattern indicating a potential trend reversal, which could further increase bullish momentum. However, it is important to note that a price pullback is still possible despite this pattern.
The coin must remain above the two vital price levels to continue its upward trend. Currently, Dogecoin remains stuck under a crucial resistance mark.
Dogecoin Price Analysis: One-Day Chart
Technical Analysis
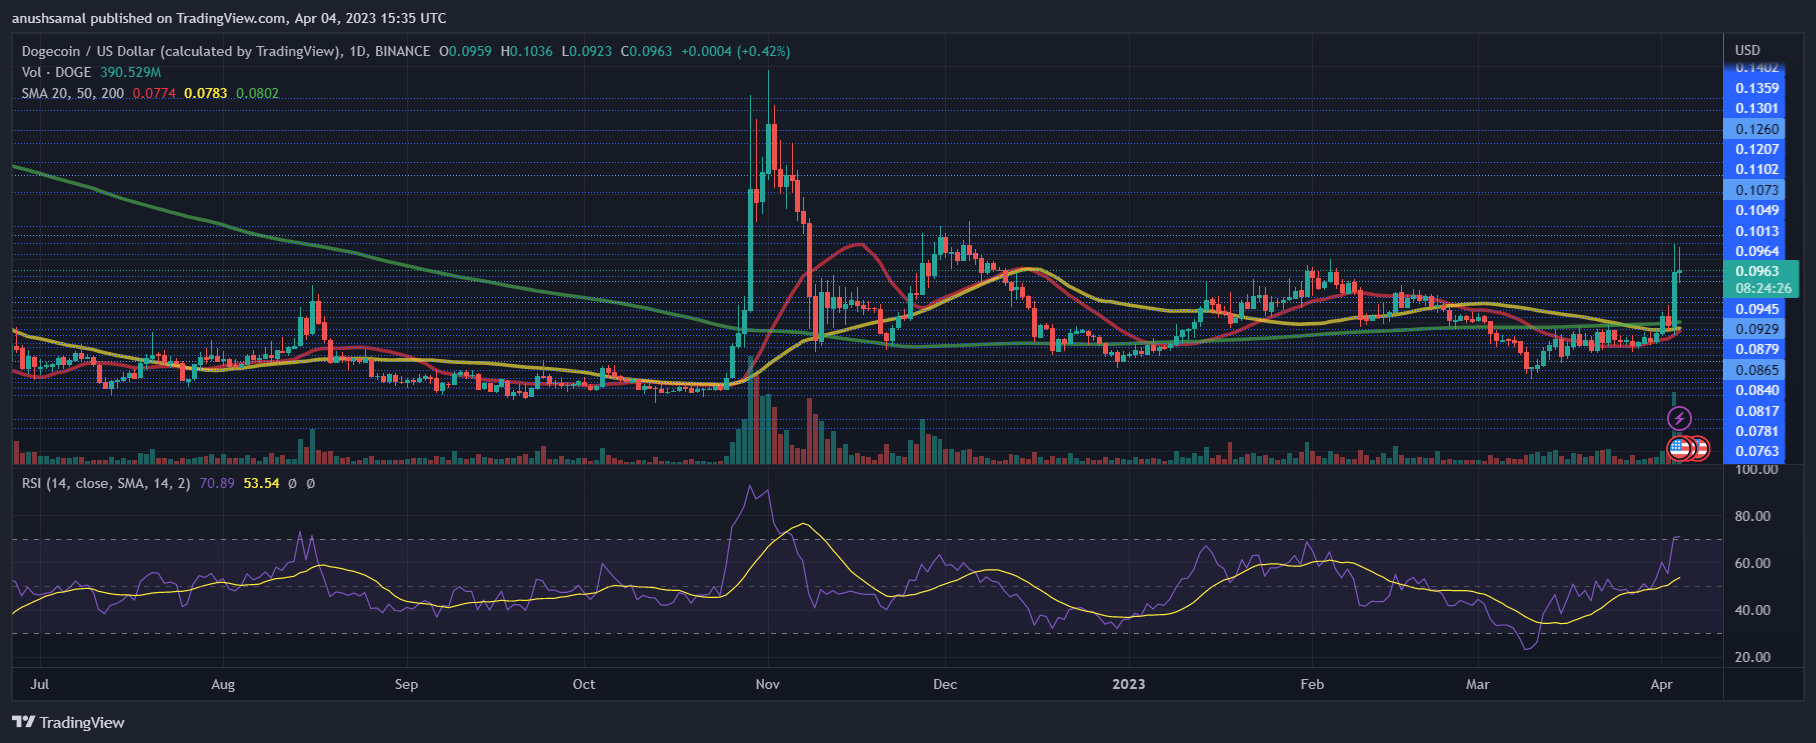
Buying strength of DOGE witnessed a sharp surge, causing the asset to become overbought and overvalued at the time of writing. This was indicated by the Relative Strength Index (RSI) standing above 70, a signal for an overbought asset.
Typically, after being overbought, the asset’s price tends to undergo a significant pullback. Likewise, Dogecoin moved above the 20-Simple Moving Average (SMA) line. This signified that buyers were driving the price momentum in the market.
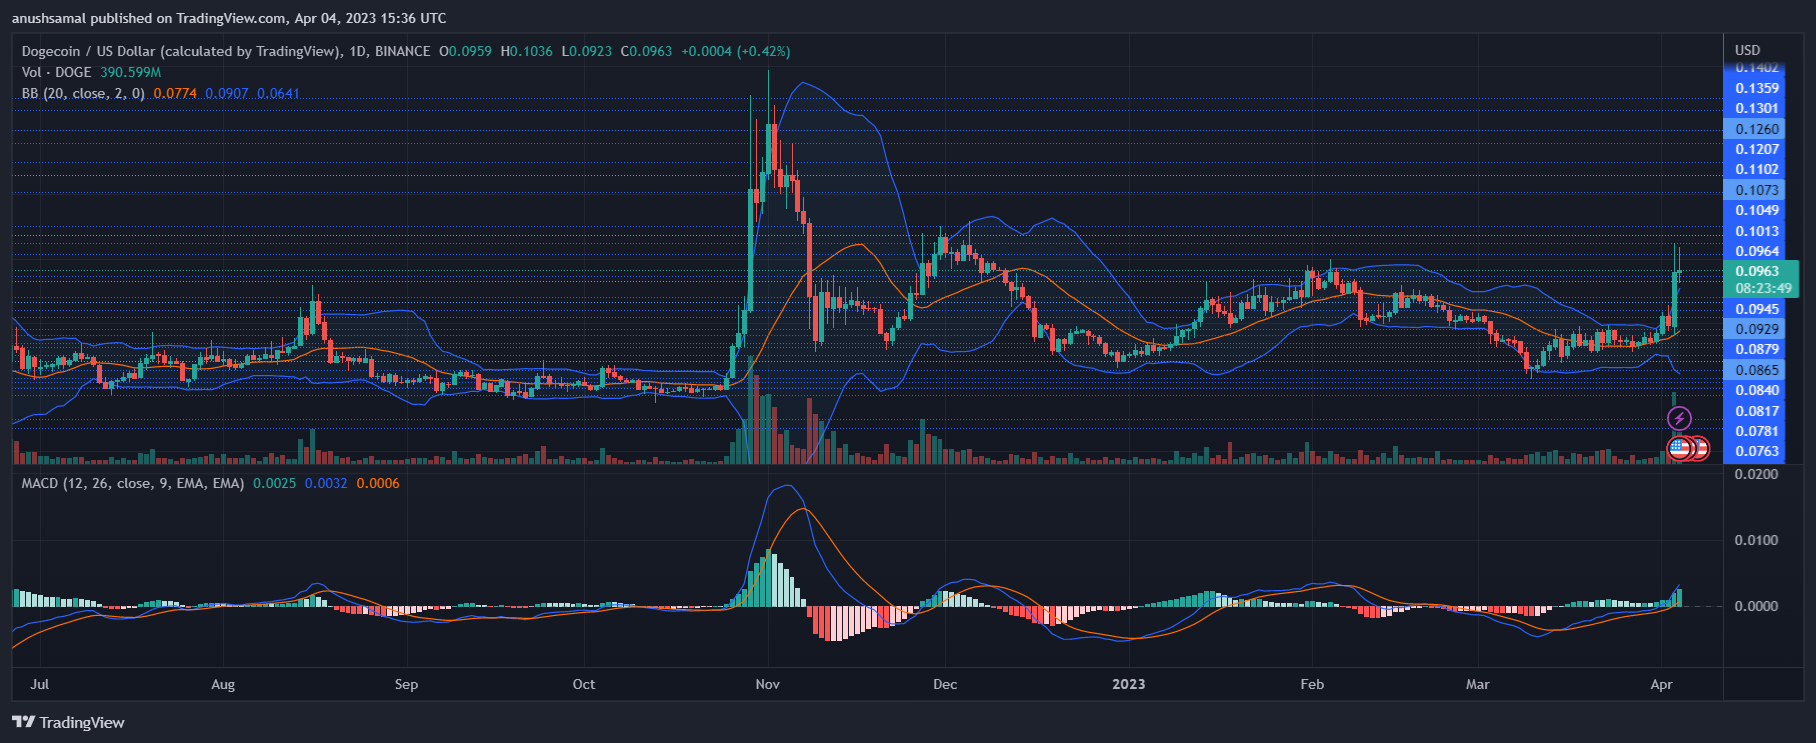
With the increase in demand, other technical indicators have also aligned with the bulls. The Moving Average Convergence Divergence (MACD), which indicates price trends and reversals, turned green with growing green signal bars tied to buy signals for the coin at the time of writing.
Bollinger Bands also opened up significantly, indicating that the possibility of price volatility and fluctuation cannot be ignored.
Source: Read Full Article