
Ethereum (ETH) is in a downtrend today after being rejected at the $4,600 resistance zone. Yesterday, buyers tried to break above the 21-day moving average line but were rejected.
If the price breaks above the moving averages, it would be a sign of resumption of the uptrend. Also, the largest altcoin could rise to a high of $4,800. However, if Ether falls, it will find support above the 50-day moving average. Since November 22, ETH/USD has been fluctuating between the 50-day line and the 21-day moving averages. The altcoin will move when these moving averages are broken.
Ethereum indicator analysis
Ether is at level 48 of the Relative Strength Index for period 14. The cryptocurrency is still in a downward correction and below the midline 50. The price of the cryptocurrency is between the moving averages, which indicates a possible sideways movement. The altcoin is in bearish momentum as it is below the 50% area of the daily stochastic.
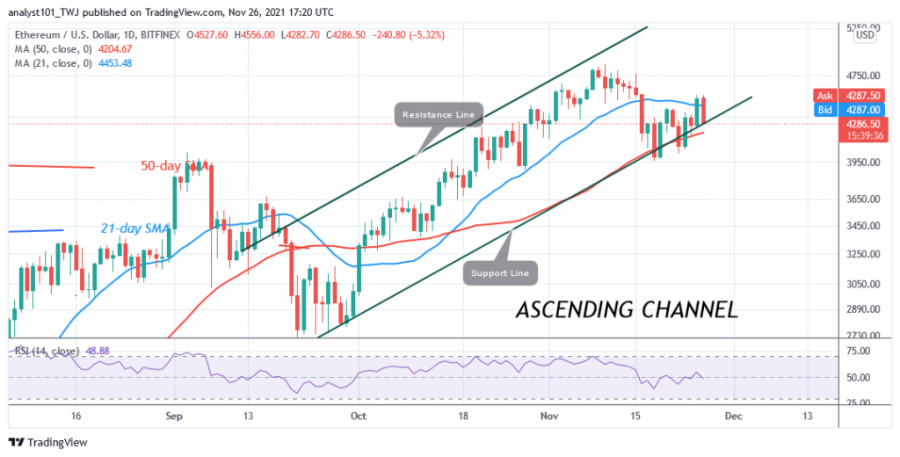
Technical indicators:
Major Resistance Levels – $4,500 and $5,000
Major Support Levels – $3,500 and $3,000
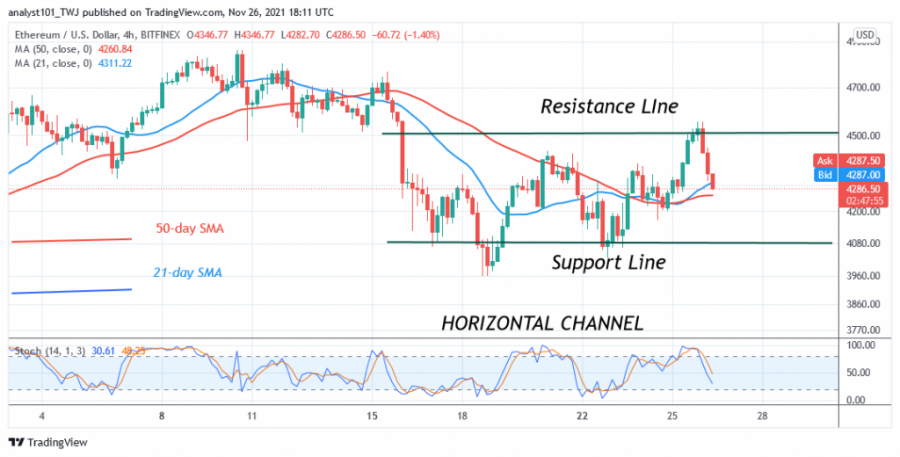
What is the next direction for Ethereum?
On the 4-hour chart, Ethereum is in a sideways movement and the price is fluctuating between $4,050 and $4,500. For example, ETH buyers drove the price to the high of $4,500. The altcoin was pushed back at resistance as the market fell back to the lower price range. This is the price action since November 17.
Disclaimer. This analysis and forecast are the personal opinions of the author and are not a recommendation to buy or sell cryptocurrency and should not be viewed as an endorsement by CoinIdol. Readers should do their research before investing funds.
Source: Read Full Article