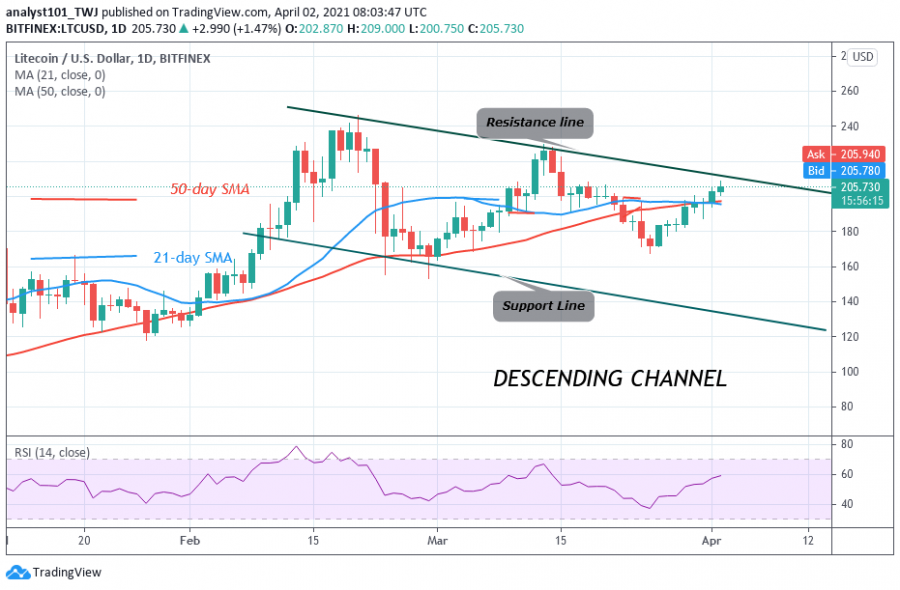
For the past week, LTC/USD has been in an upward move. The current uptrend is facing resistance at the $210 price level. Incidentally, if buyers have broken the recent high, the altcoin would have been out of the bearish trend zone.
Litecoin will have price acceleration on the upside. The bulls will have the opportunity to retest the $230 and $240 resistance levels. Presently, the upward move is doubtful because the price indicators have shown the overbought condition of the market. However, If the LTC price turns down from the recent high, the market will fall to the previous range bound zone between $195 and $210. Litecoin is trading at $205 at the time of writing.
Litecoin indicator analysis
The current uptrend is approaching the resistance line of the descending channel. Nevertheless, if buyers succeed in breaking the resistance line and price closes above it, the bearish trend is presumed to be terminated. The daily stochastic has indicated that LTC is above the 80% range of the market. That is the market has reached the overbought region.
Technical indicators:
Major Resistance Levels – $240 and $260
Major Support Levels – $160 and $140
What is the next move for Litecoin?
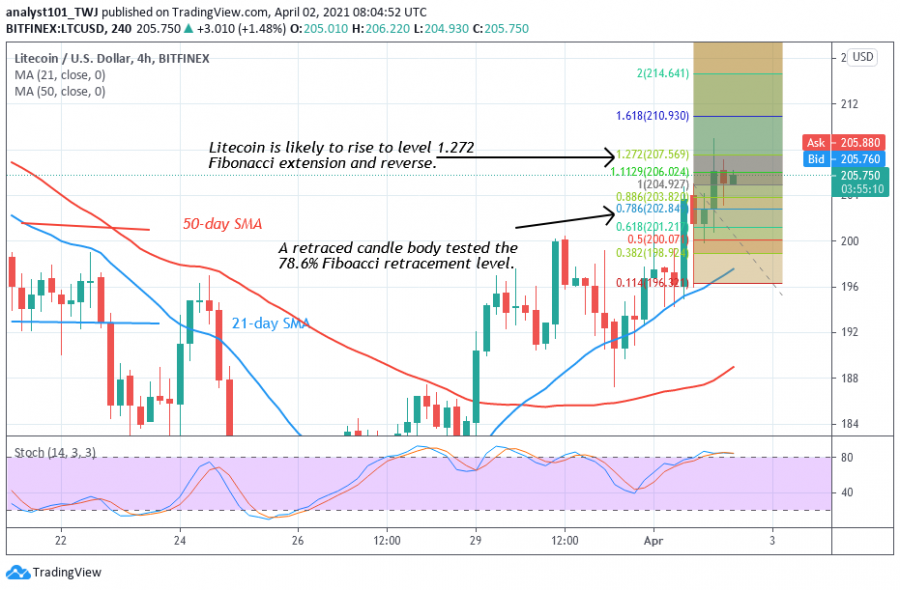
LTC/USD is likely to be range-bound for a few more days as the upward move is unlikely. On April 1 uptrend; a retraced candle body tested the 78.6% Fibonacci retracement level. This retracement determines the extent of price movement. It indicates that LTC will rise and reverse at level 1.272 Fibonacci extension or the high of $207.56. From the price action, the market has already reversed and it is approaching level 78.6% Fibonacci retracement where it originated.
Disclaimer. This analysis and forecast are the personal opinions of the author are not a recommendation to buy or sell cryptocurrency and should not be viewed as an endorsement by CoinIdol. Readers should do their own research before investing funds.
Source: Read Full Article