
Bitcoin price is stuck in a range below the $33,500 and $33,800 resistance levels against the US Dollar. BTC is likely to continue lower unless it clears the $33,800 resistance.
- Bitcoin retested the $31,000 zone and managed to stay in a range.
- The price is currently facing resistance near $32,800 and the 100 hourly simple moving average.
- There is a short-term ascending channel or a bear flag forming with support near $31,900 on the hourly chart of the BTC/USD pair (data feed from Kraken).
- The pair could trade in a range, with a strong resistance near $33,500 and $33,800.
Bitcoin Price Is Facing Strong Resistance
After a failed attempt to clear the $35,000 resistance, bitcoin price trimmed gains and traded below $33,800. BTC even broke the $32,500 level and settled below the 100 hourly simple moving average.
There was a spike below the $31,000 level, but it remained stable above $30,800. A low is formed near $30,823 and the price is currently recovering higher. It surpassed the 23.6% Fib retracement level of the downward move from the $34,915 high to $30,823 low.
Bitcoin price is currently facing resistance near $32,800 and the 100 hourly simple moving average. The 50% Fib retracement level of the downward move from the $34,915 high to $30,823 low is also near $32,800.
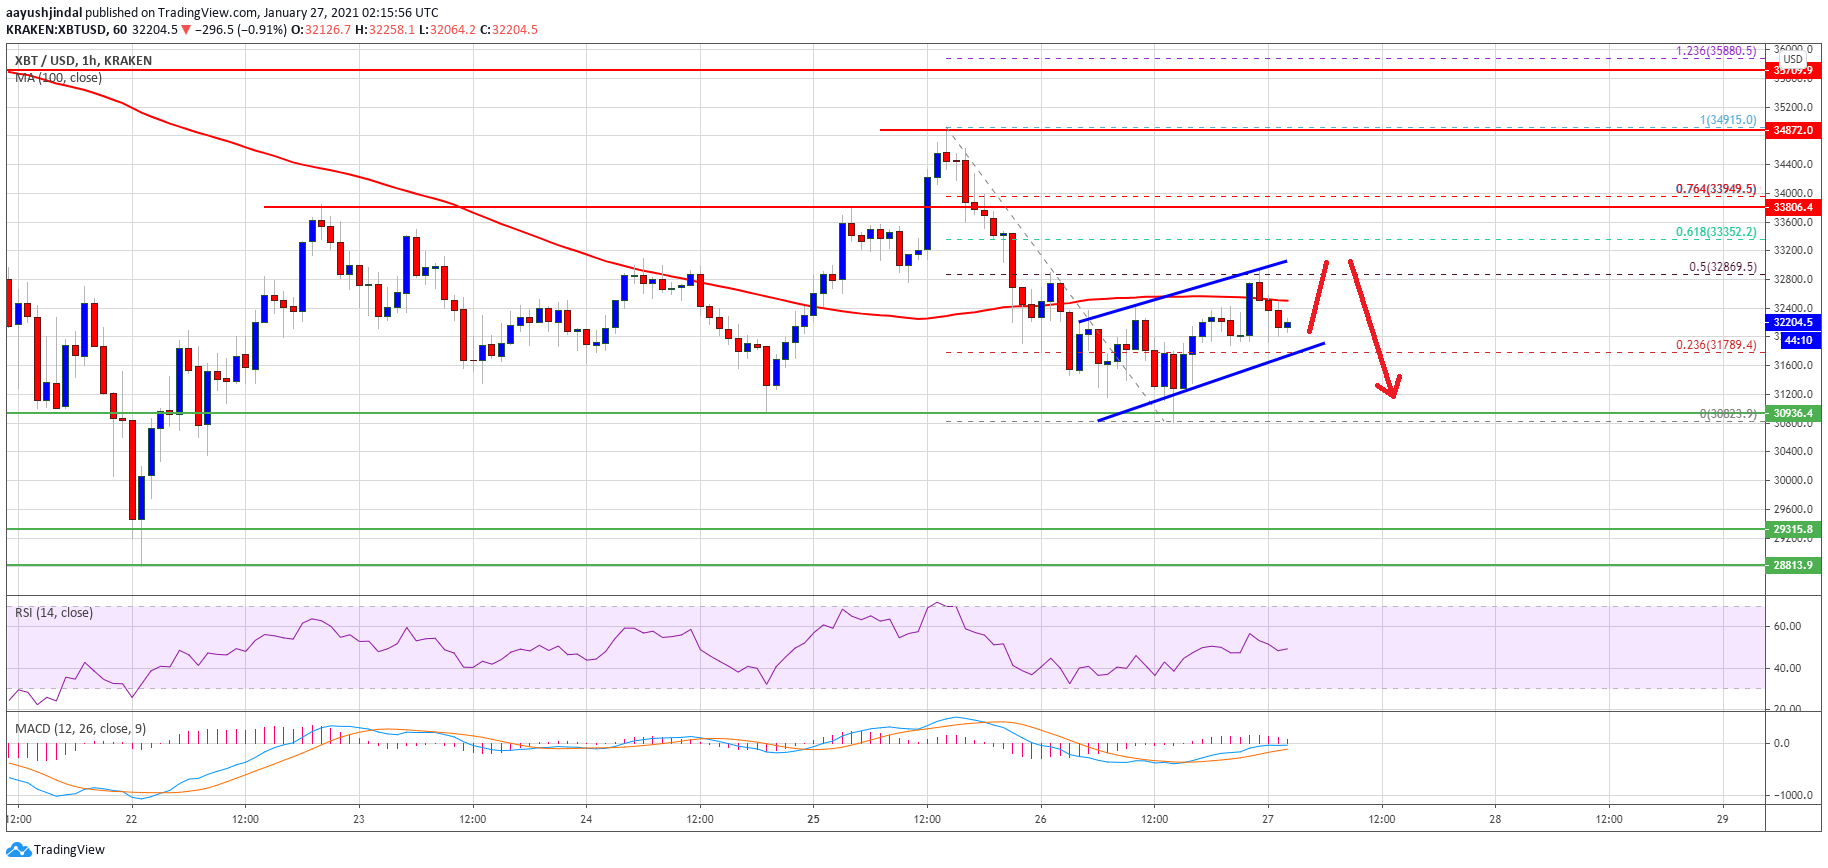
Source: BTCUSD on TradingView.com
At the outset, it seems like there is a short-term ascending channel or a bear flag forming with support near $31,900 on the hourly chart of the BTC/USD pair. To continue higher, the bulls need to gain strength above $32,500, $32,800 and the 100 hourly SMA.
The next strong resistance is near the $33,500 and $33,800 levels. A close above $33,800 could increase the chances of a steady rise in the coming sessions.
Fresh Dip in BTC?
If bitcoin fails to clear the $32,800 resistance or $33,500, it could start a fresh decline. An initial support is near the channel support at $31,900.
A clear break below the channel support could open the doors for a larger decline towards the $30,800 support. Any more losses may possibly call for a downside break below the $30,000 support zone.
Technical indicators:
Hourly MACD – The MACD is struggling to gain momentum in the bullish zone.
Hourly RSI (Relative Strength Index) – The RSI for BTC/USD is now close to the 50 level.
Major Support Levels – $31,800, followed by $30,800.
Major Resistance Levels – $32,800, $33,500 and $33,800.
Source: Read Full Article