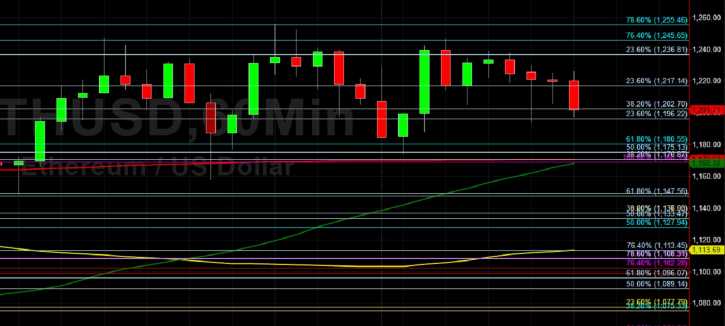
Ethereum (ETH/USD) drifted lower early in today’s North American session as the pair came off to the 1193.55 area after trading as high as the 1255.59 level during the Asian session, with the intraday high representing a test of the 78.6% retracement of the recent depreciating range from 1350.88 to 905.00. Traders drove ETH/USD as low as the 1174.06 area during the European session, with that intraday low representing a test of the 50% retracement of the recent appreciating range from 1058.32 to 1291.94. An important technical level that chartists are watching is the 37249.25 area, representing the 23.6% retracement of a broader appreciating range from 21913.84 to 41986.37. If ETH/USD is able to extend its recent comeback further, some immediate area of potential technical resistance include the 1381.03, 1439.98, 1582.86, and 1665.31 areas. If ETH/USD weakens and returns to its pullback lower, downside retracement areas and additional levels of potential technical support include the 976.37, 954.16, 941.22, 917.03, 915.48, 902.24, 895.33, 869.22, 860.69, 856.83, 844.44, 831.94, 828.97, 812.73, 783.02, 770.03, 763.66, 750.28, 745.01, and 723.97 areas.
During ETH/USD’s recent move higher to multi-year highs, Stops were recently elected above the 1072.78, 1133.44, 1163.93, 1176.28, 1225.30, and 1230.73 areas, and selling pressure intensified below these areas during the pullback. Notably, these levels represented technically significant upside price objectives related to historical buying pressure around the 215.16, 625.01, 370.50, 480.08, 530.32, and 310.79 areas. Strong Stops were also recently elected above the 819.23, 877.81, and 879.23 levels during the sharp climb, upside price objectives also related to previous buying activity around the 625.01 and 530.32 areas, and traders are curious to see how price activity reacts around these levels. Traders are observing that the 50-bar MA (4-hourly) is bullishly indicating above the 100-bar MA (4-hourly) and above the 200-bar MA (4-hourly). Also, the 50-bar MA (hourly) is bearishly indicating below the 200-bar MA (hourly) and above the 200-bar MA (hourly).
Price activity is nearest the 50-bar MA (4-hourly) at 1170.00 and the 200-bar MA (Hourly) at 1170.62.
Technical Support is expected around 792.40/ 766.54/ 729.88 with Stops expected below.
Technical Resistance is expected around 1381.04/ 1419.96/ 1439.98 with Stops expected above.
On 4-Hourly chart, SlowK is Bearishly below SlowD while MACD is Bullishly above MACDAverage.
On 60-minute chart, SlowK is Bearishly below SlowD while MACD is Bearishly below MACDAverage.
Disclaimer: This trading analysis is provided by a third party, and for informational purposes only. It does not reflect the views of Crypto Daily, nor is it intended to be used as legal, tax, investment, or financial advice.
Related TAGS:
You can share this post!
Source: Read Full Article