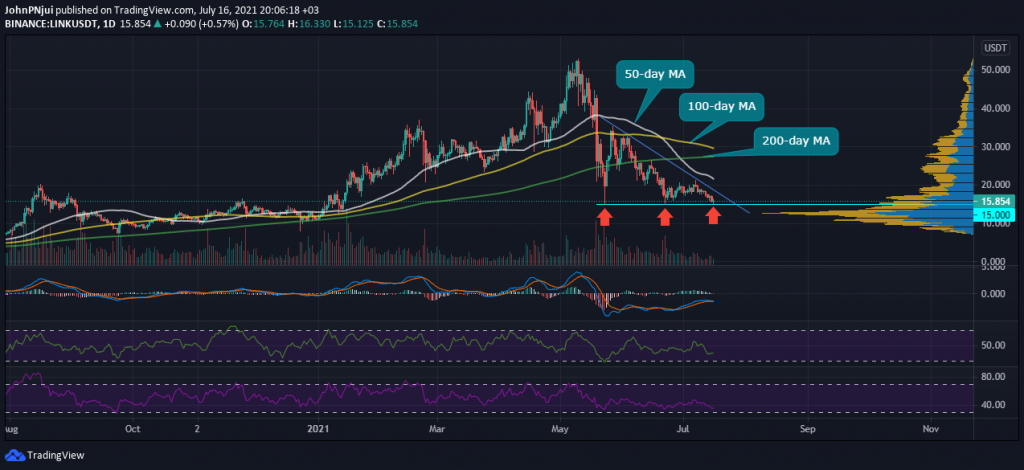
Also from the chart above, the following can be observed:
- Chainlink remains in bearish territory as it trades below the 50-day, 100-day and 200-day moving averages
- A descending triangle has formed on the daily LINK/USDT chart with a floor at $15
- Chainlink’s daily trade volume has been reducing since mid-May
- The histograms of the daily MACD also confirm a reduction in trading of Chainlink in the crypto markets
- The daily MACD also confirms an ongoing bearish scenario for LINK
- The daily MFI and RSI are in neutral territory with a slight inclination towards a bearish continuation for Chainlink
Chainlink’s $15 is the Level to Watch and Could be Tied to Bitcoin Maintaining its $30k Support
As earlier mentioned, earlier today Chainlink bounced off the $15 support area as Bitcoin experienced a daily low of $31k. Bitcoin is now trading at $32k as Chainlink hovers at the $15.80 price area.
To note is that Bitcoin has maintained the $31k to $30k price area as support since mid-May thus leading to the loose conclusion that Chainlink’s fate above $15, is tied to Bitcoin maintaining a price above this crucial price area.
Consequently, if Bitcoin loses $30k over the weekend, Chainlink will most likely lose its $15 support and go on to retest the $13 to $12 support zone.
Source: Read Full Article


