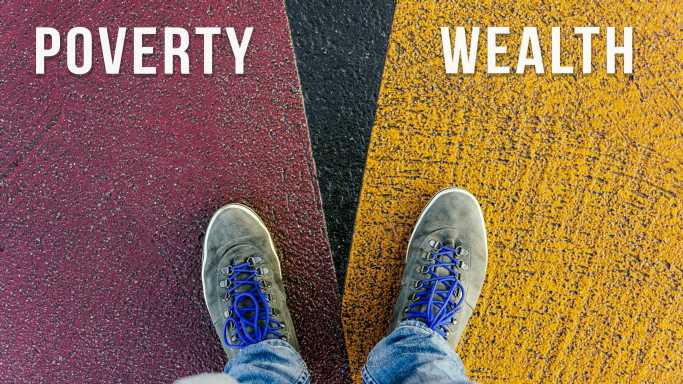
How many people were lifted out of poverty by programs that put $400 billion into the COVID-19-damaged economy? According to the Supplemental Poverty Measure (SPM) from the U.S. Census Bureau, the total was 11.7 million in 2020, a remarkable number.
Even with this advance, the richest Americans have done better recently. The top 10% of Americans based on net worth hold 69.8% of the total wealth across the U.S. population. The top 1% hold 32.1%
Income inequality varies considerably within the United States, and in some parts of the country it is far more pronounced than in others.
Using data from the U.S. Census Bureau’s 2019 American Community Survey, 24/7 Wall St. identified the state with the widest income gap. States are ranked by their Gini coefficient, a measure of income inequality based on the distribution of income across a population on a 0 to 1 scale, with 0 representing perfect equality and 1 representing the highest possible level of inequality.
Depending on the state, income inequality ranges from a Gini score of 0.427 to 0.515. Nationwide, the Gini coefficient stands at 0.481.
The causes of rising inequality are complex and varied. A report published by the National Bureau of Economic Research ties the rising disparity to a range of economic factors, including globalization, technological advancement, a stagnant minimum wage and the decline of labor unions.
The state with the widest income gap is New York. Here are the details:
- Gini index: 0.515
- Average household income, top 20%: $291,906 (fifth highest)
- Average household income, bottom 20%: $13,372 (13th lowest)
- Share of all income that went to top 20%: 54.4% (the highest)
- Share of all income that went to bottom 20%: 2.5% (the lowest)
- Median household income: $72,108 (14th highest)
Methodology: To determine the state with the widest income gaps, 24/7 Wall St. reviewed one-year estimates of the Gini Index of income inequality from the U.S. Census Bureau’s 2019 American Community Survey (ACS).
The Gini Index of income inequality summarizes income dispersion in an area on a scale from 0 to 1. A value of 0 indicates perfect equality; that is, everyone in the area receives an equal share of income. A value of 1 indicates perfect inequality; that is, only one recipient receives all the income.
States were ranked based on their Gini Index. Additional information on average household income by quintile, share of aggregate household income by quintile and median household income are also one-year estimates from the 2019 ACS.
Click here to see all the states with the widest income gaps.
Get Our Free Investment Newsletter
Source: Read Full Article
